Total visibility.
Without walking.
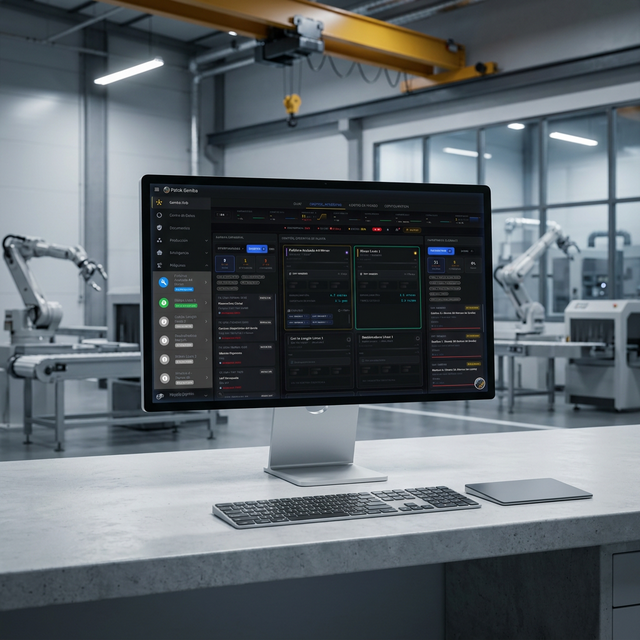
Patok's Digital Twin replicates your plant in real time. See every machine, every WIP, and every bottleneck from any screen — without setting foot on the floor.
What is the Patok Digital Twin?
A live digital replica of your entire operation. Every machine, every part in process, every work order — visualized and updated in real time. It is not a static dashboard: it is your whole plant, on your screen.
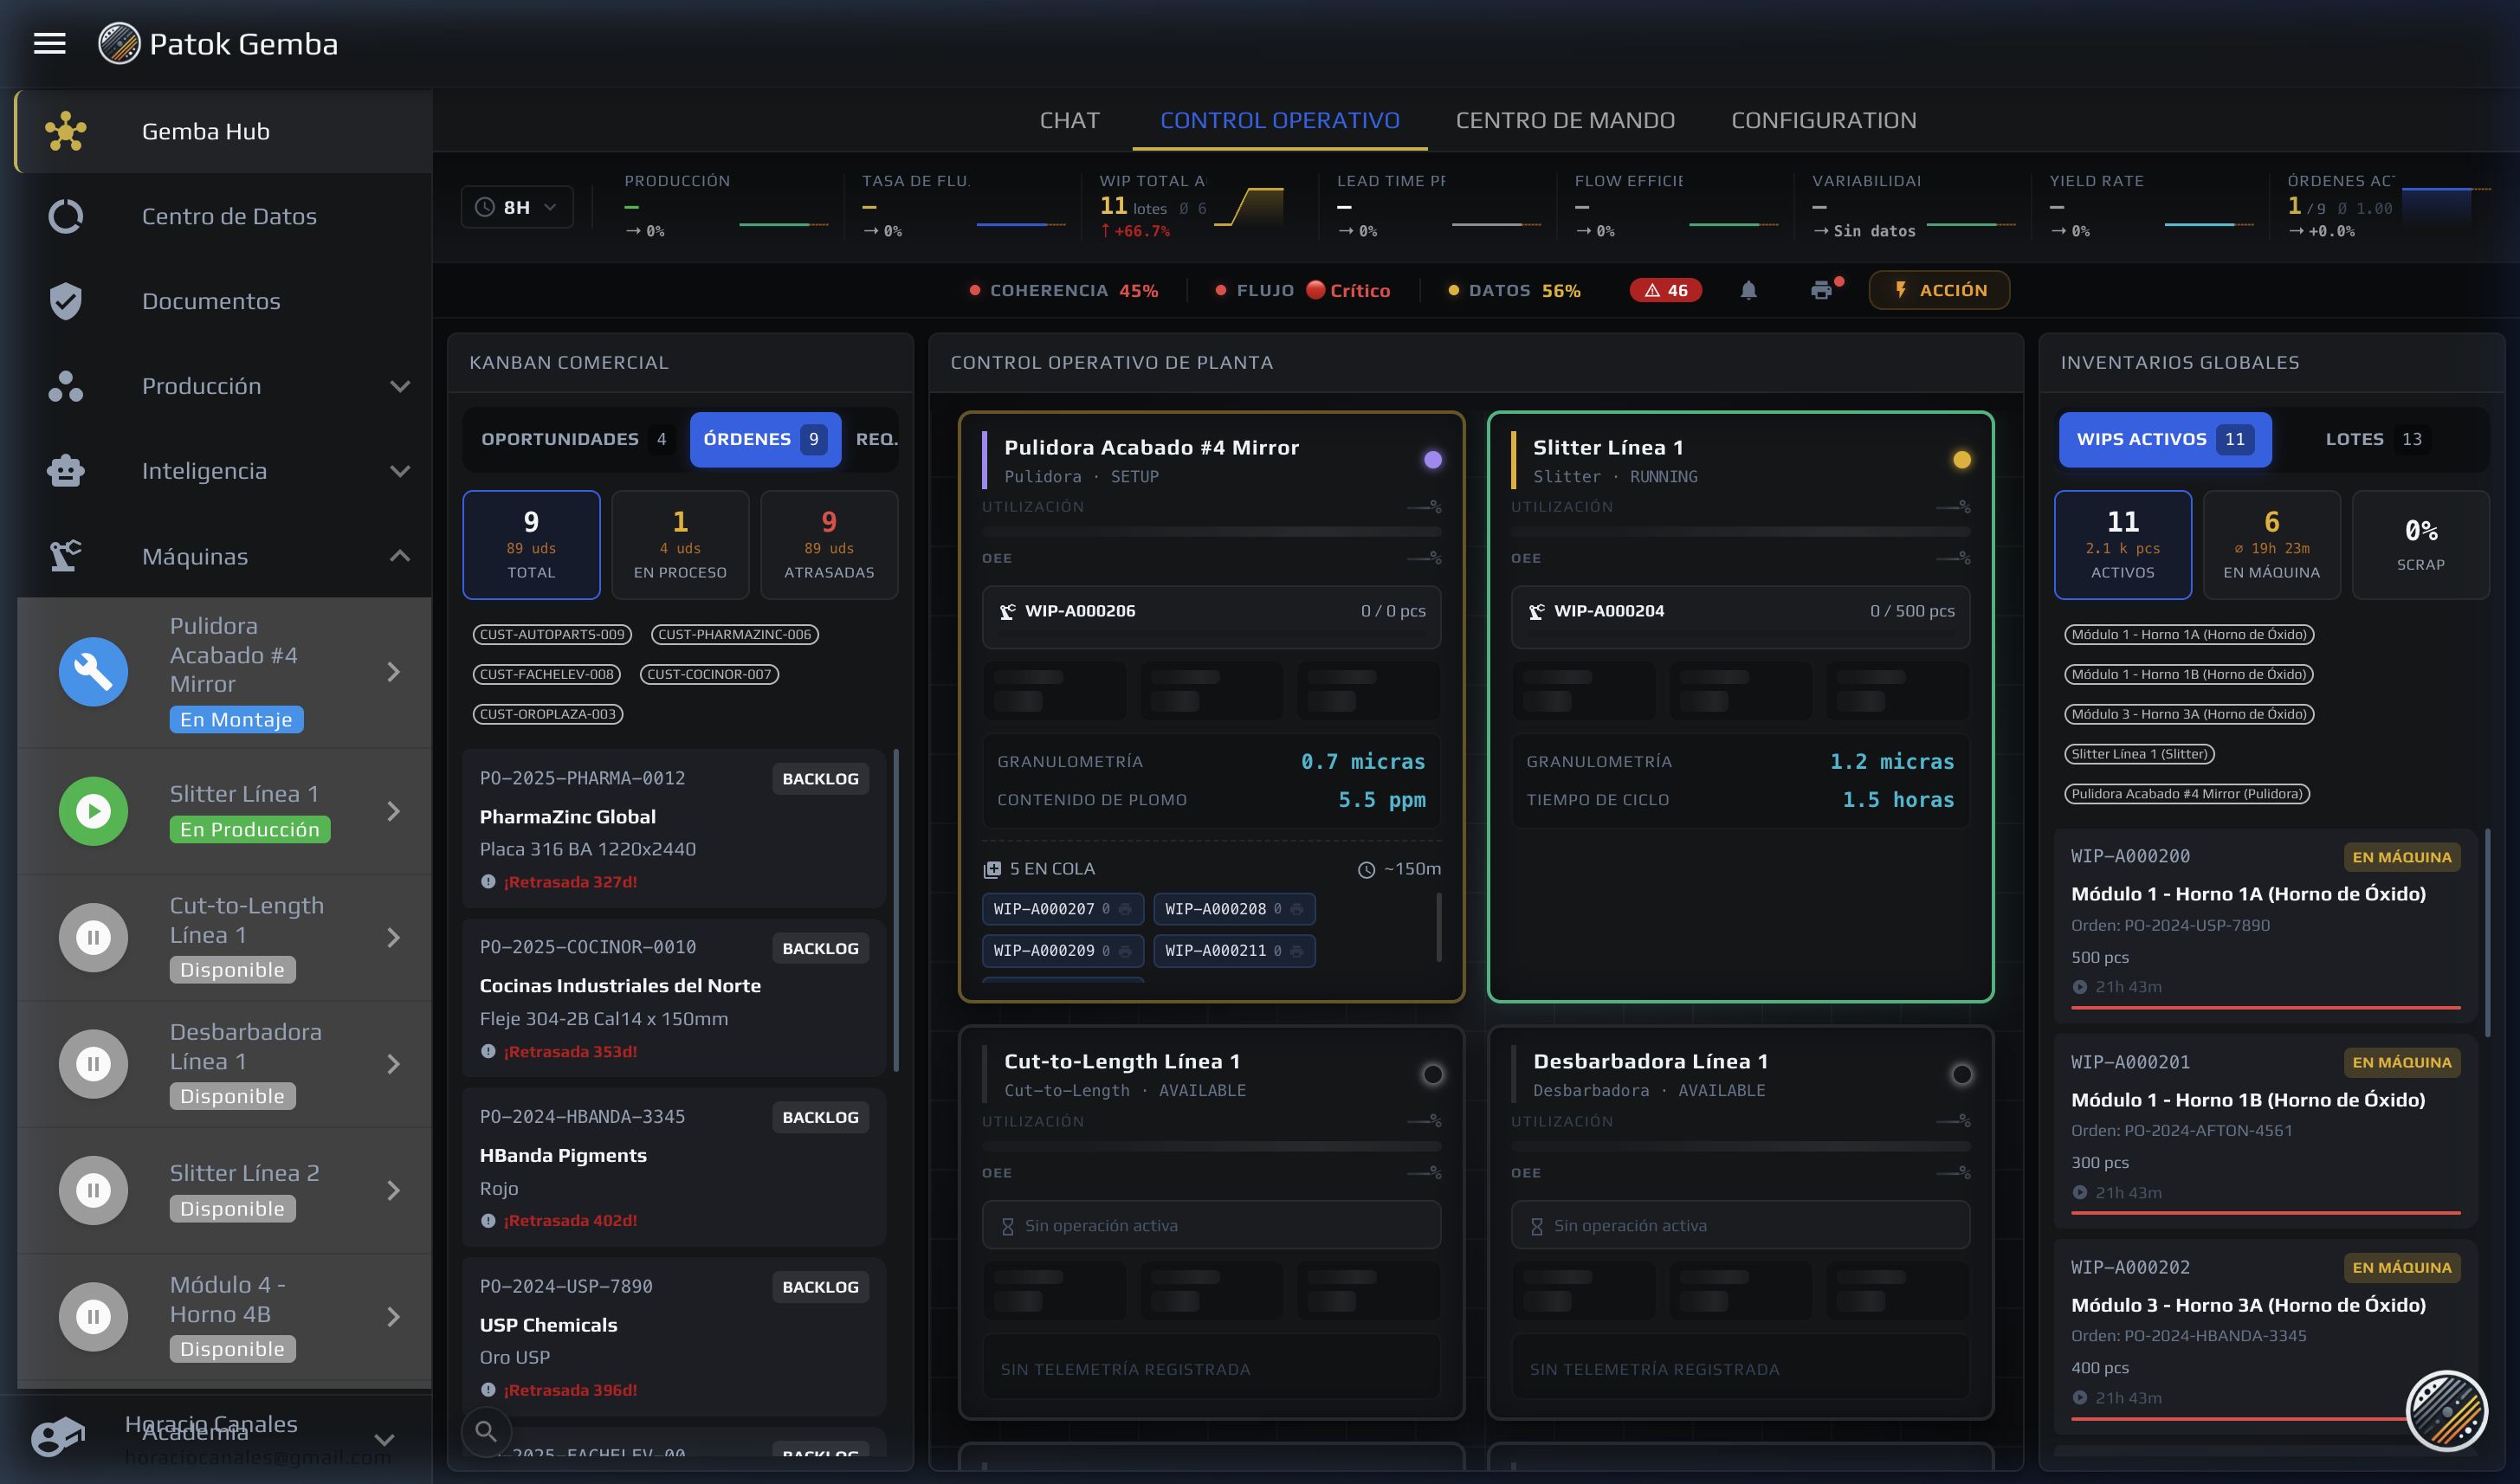
WIP Tracking
Every part in process has an identity, a location, and timestamps. You know exactly how many parts are at each workstation — and how long they have been there.
Factory Physics
Little's Law, coefficient of variation, arrival rate, and queue pressure. And when a data point is missing, the number comes back blank instead of invented.
Bottleneck Score
Automatically identifies which machine is limiting your flow. No guesswork — from queue, utilization, and cycle time data.
Sales Kanban
A Kanban board of work orders by state. See what is being produced, what is waiting, and what has shipped — visually and in real time.
That simple. That fast.
Connect
Put tablets or cameras at your workstations. Patok is configured in minutes, with no wiring and no complex integrations.
Scan
Operators scan QR codes as they move parts. Every scan feeds the Digital Twin with live data from the floor.
See everything
From any screen, watch your whole plant: machines, WIP, times, bottlenecks — all updated in real time.
Metrics that used to be invisible
The Digital Twin calculates these metrics from what your people already log on the floor — no extra sensors, nothing to wire.
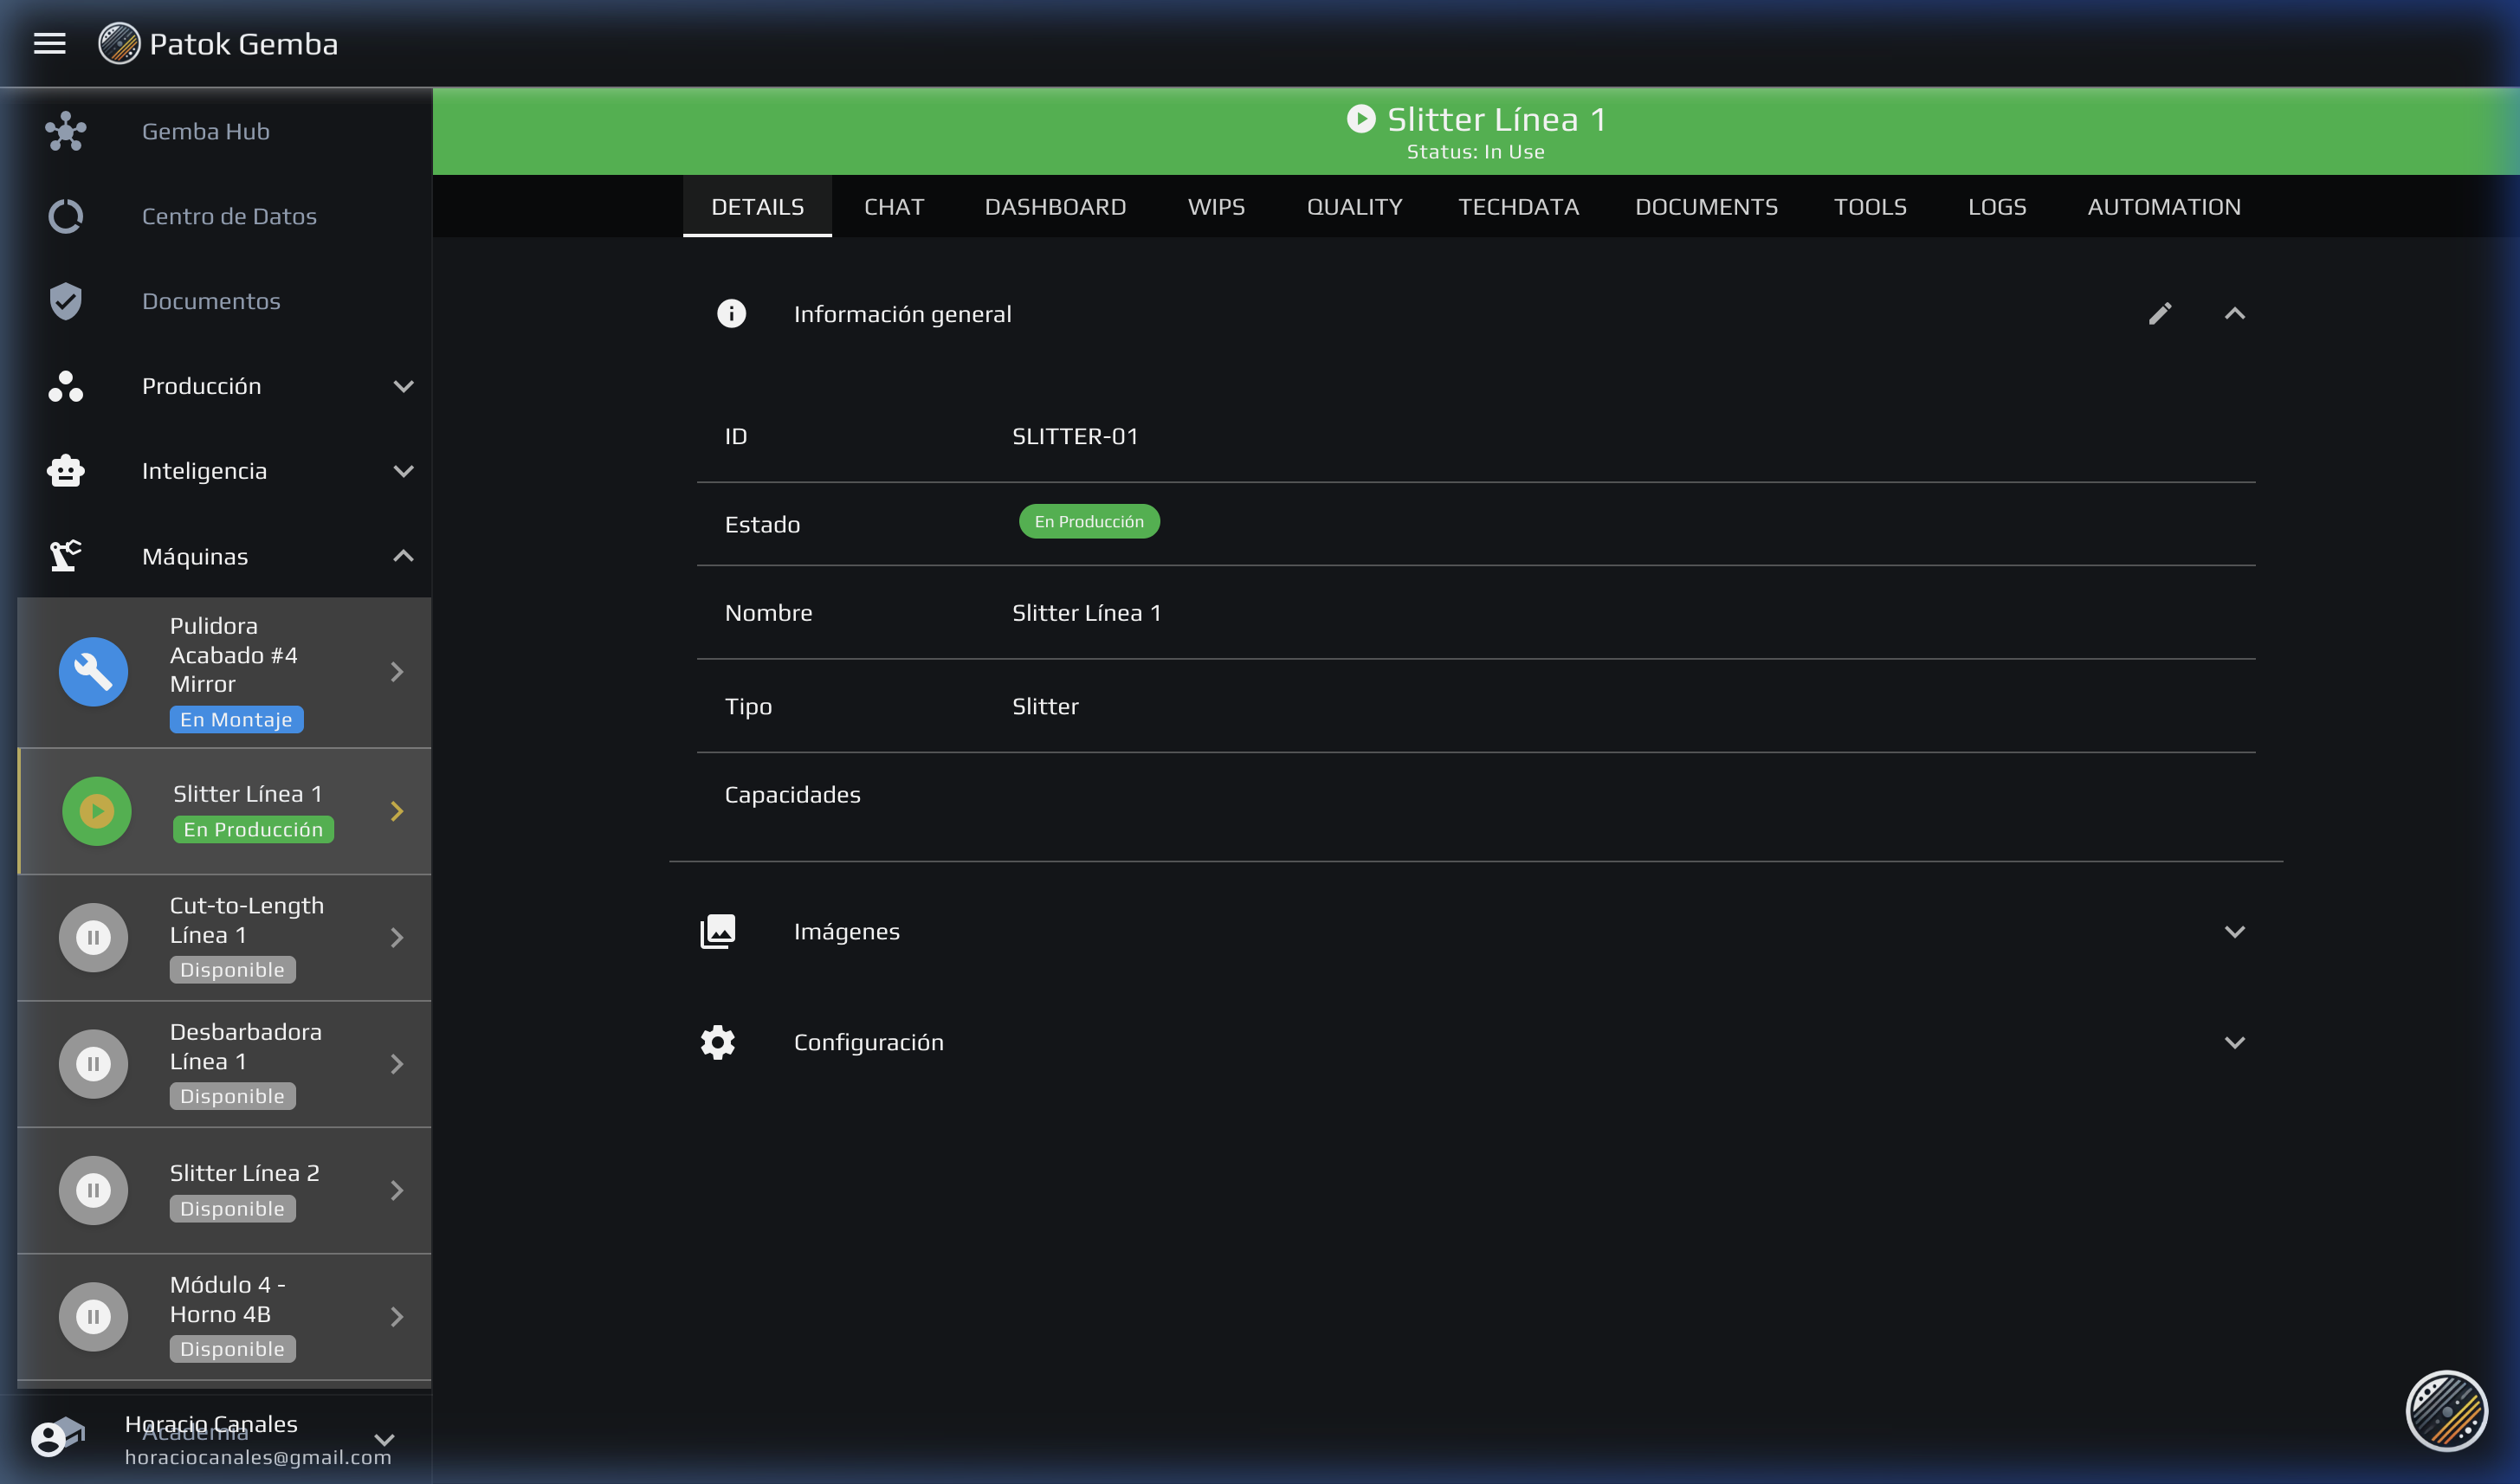
This is real. This is Patok.
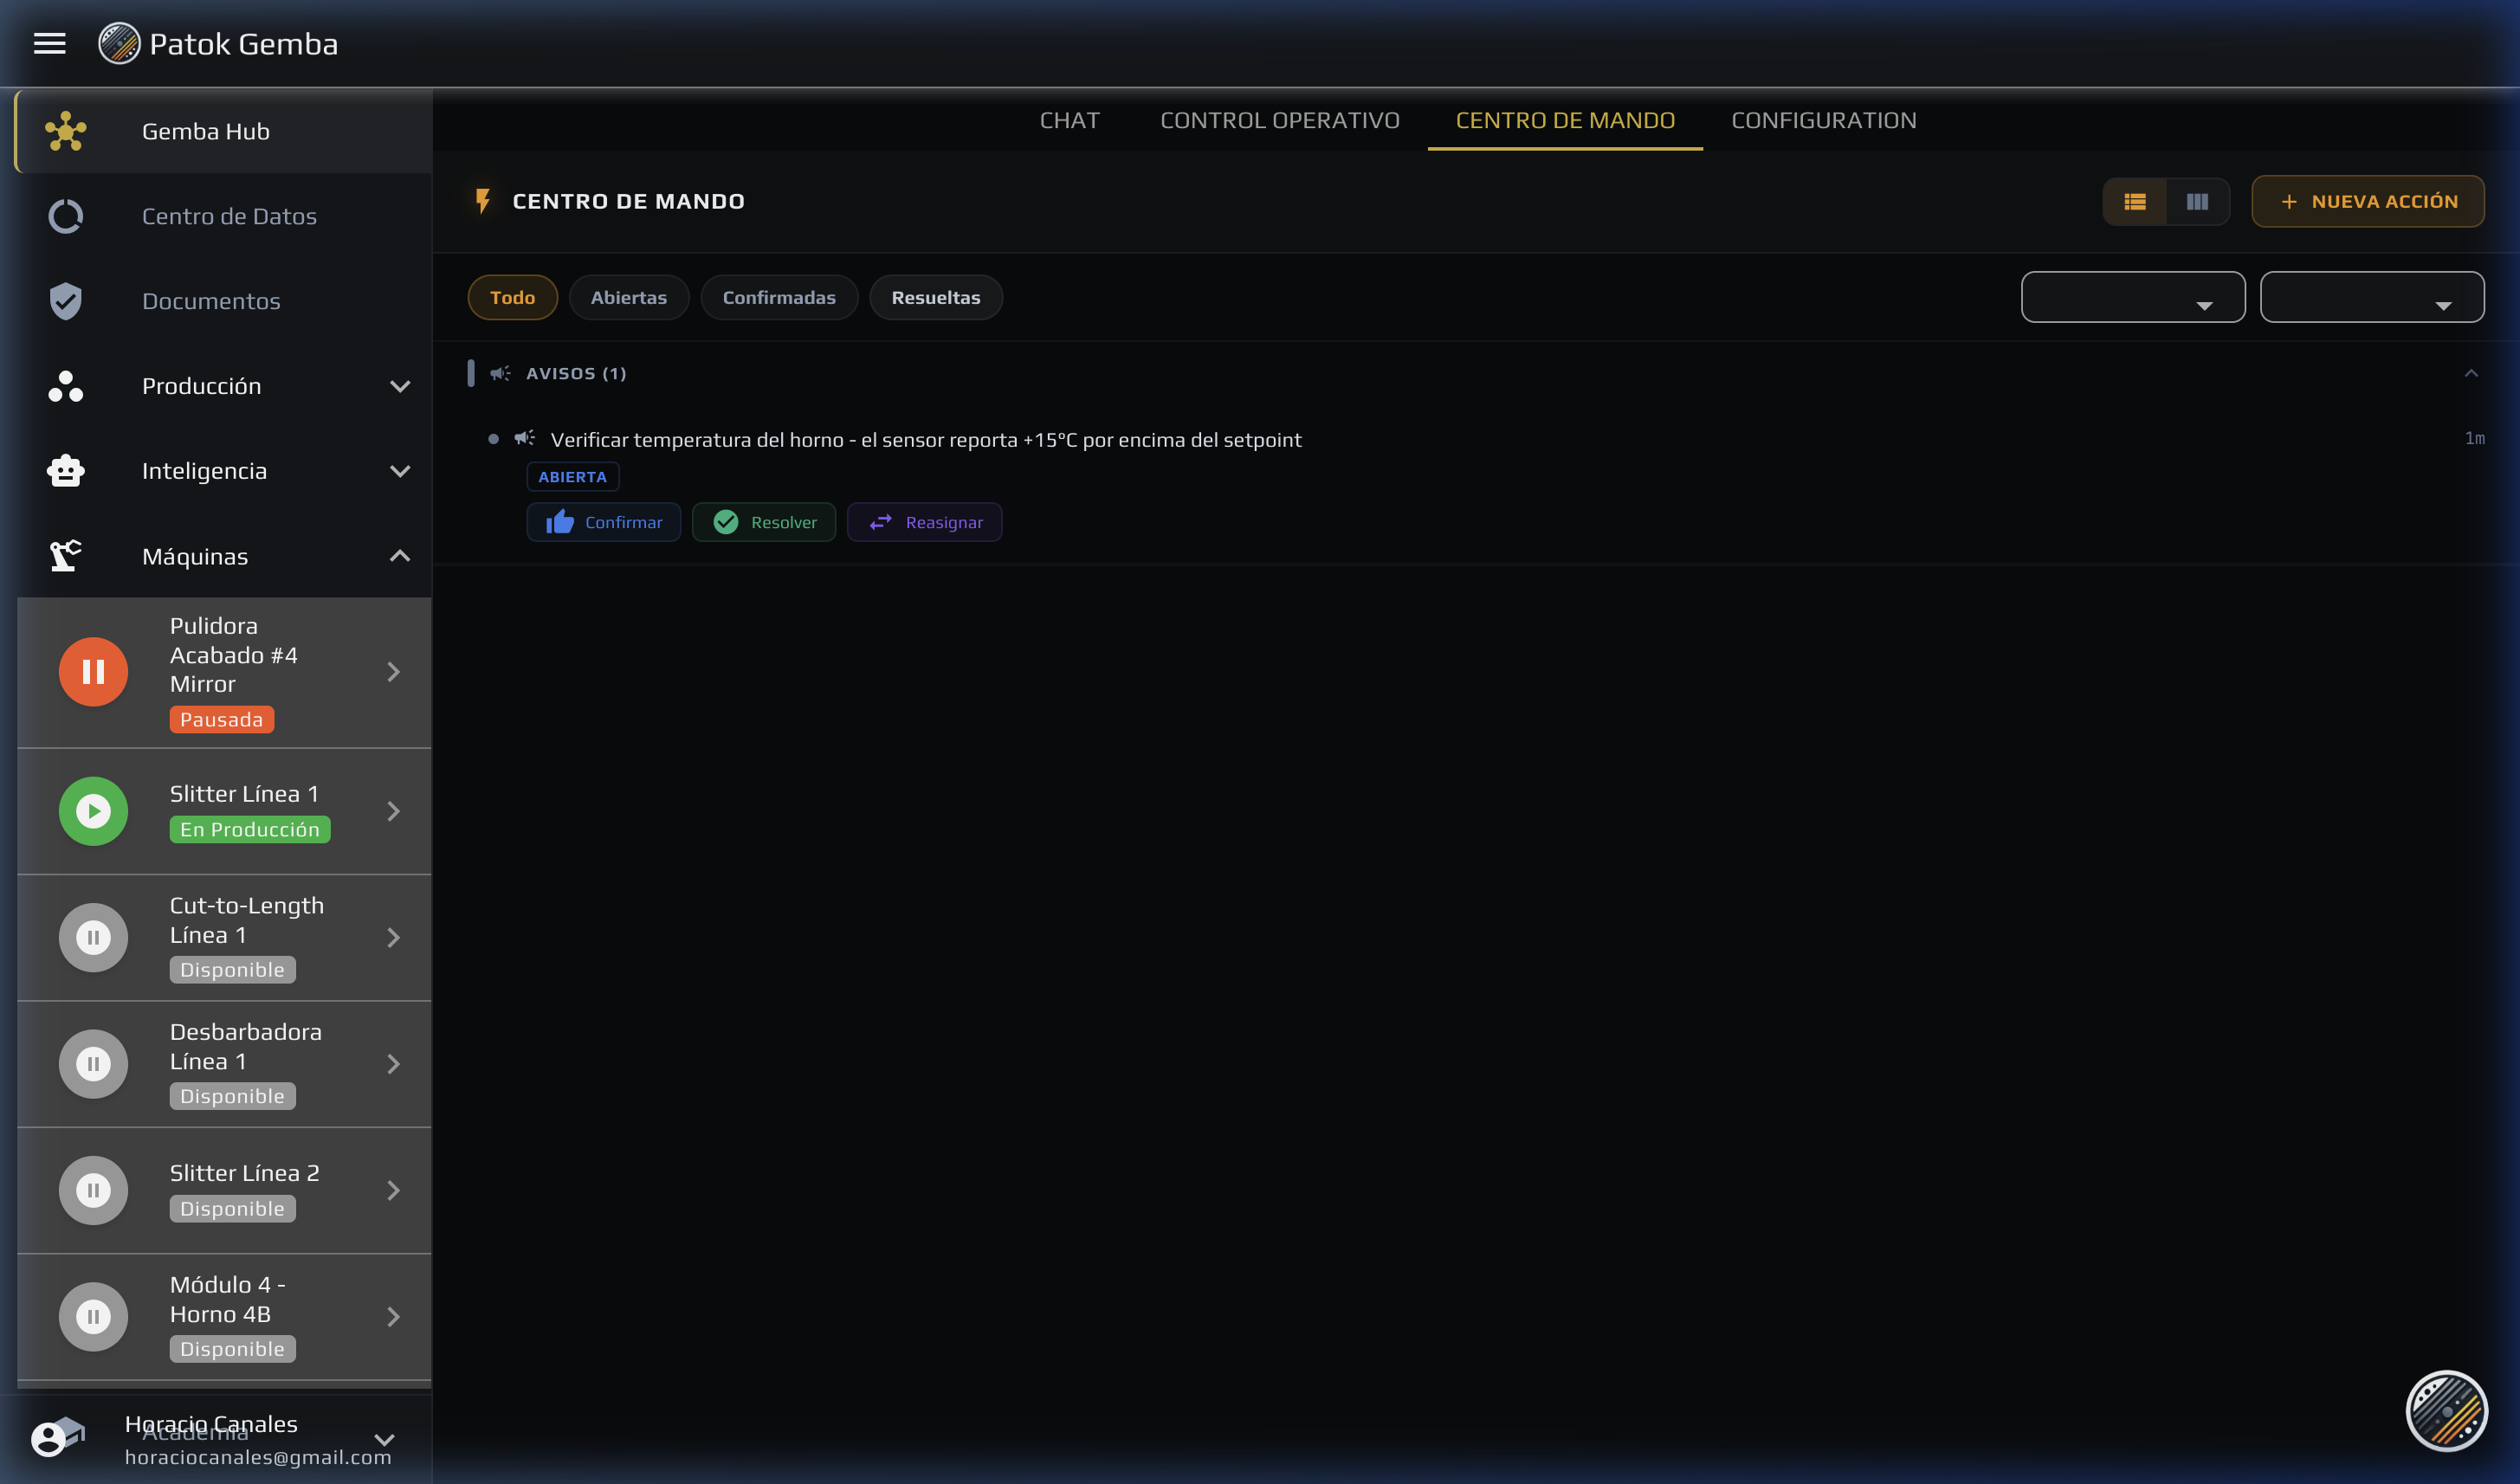
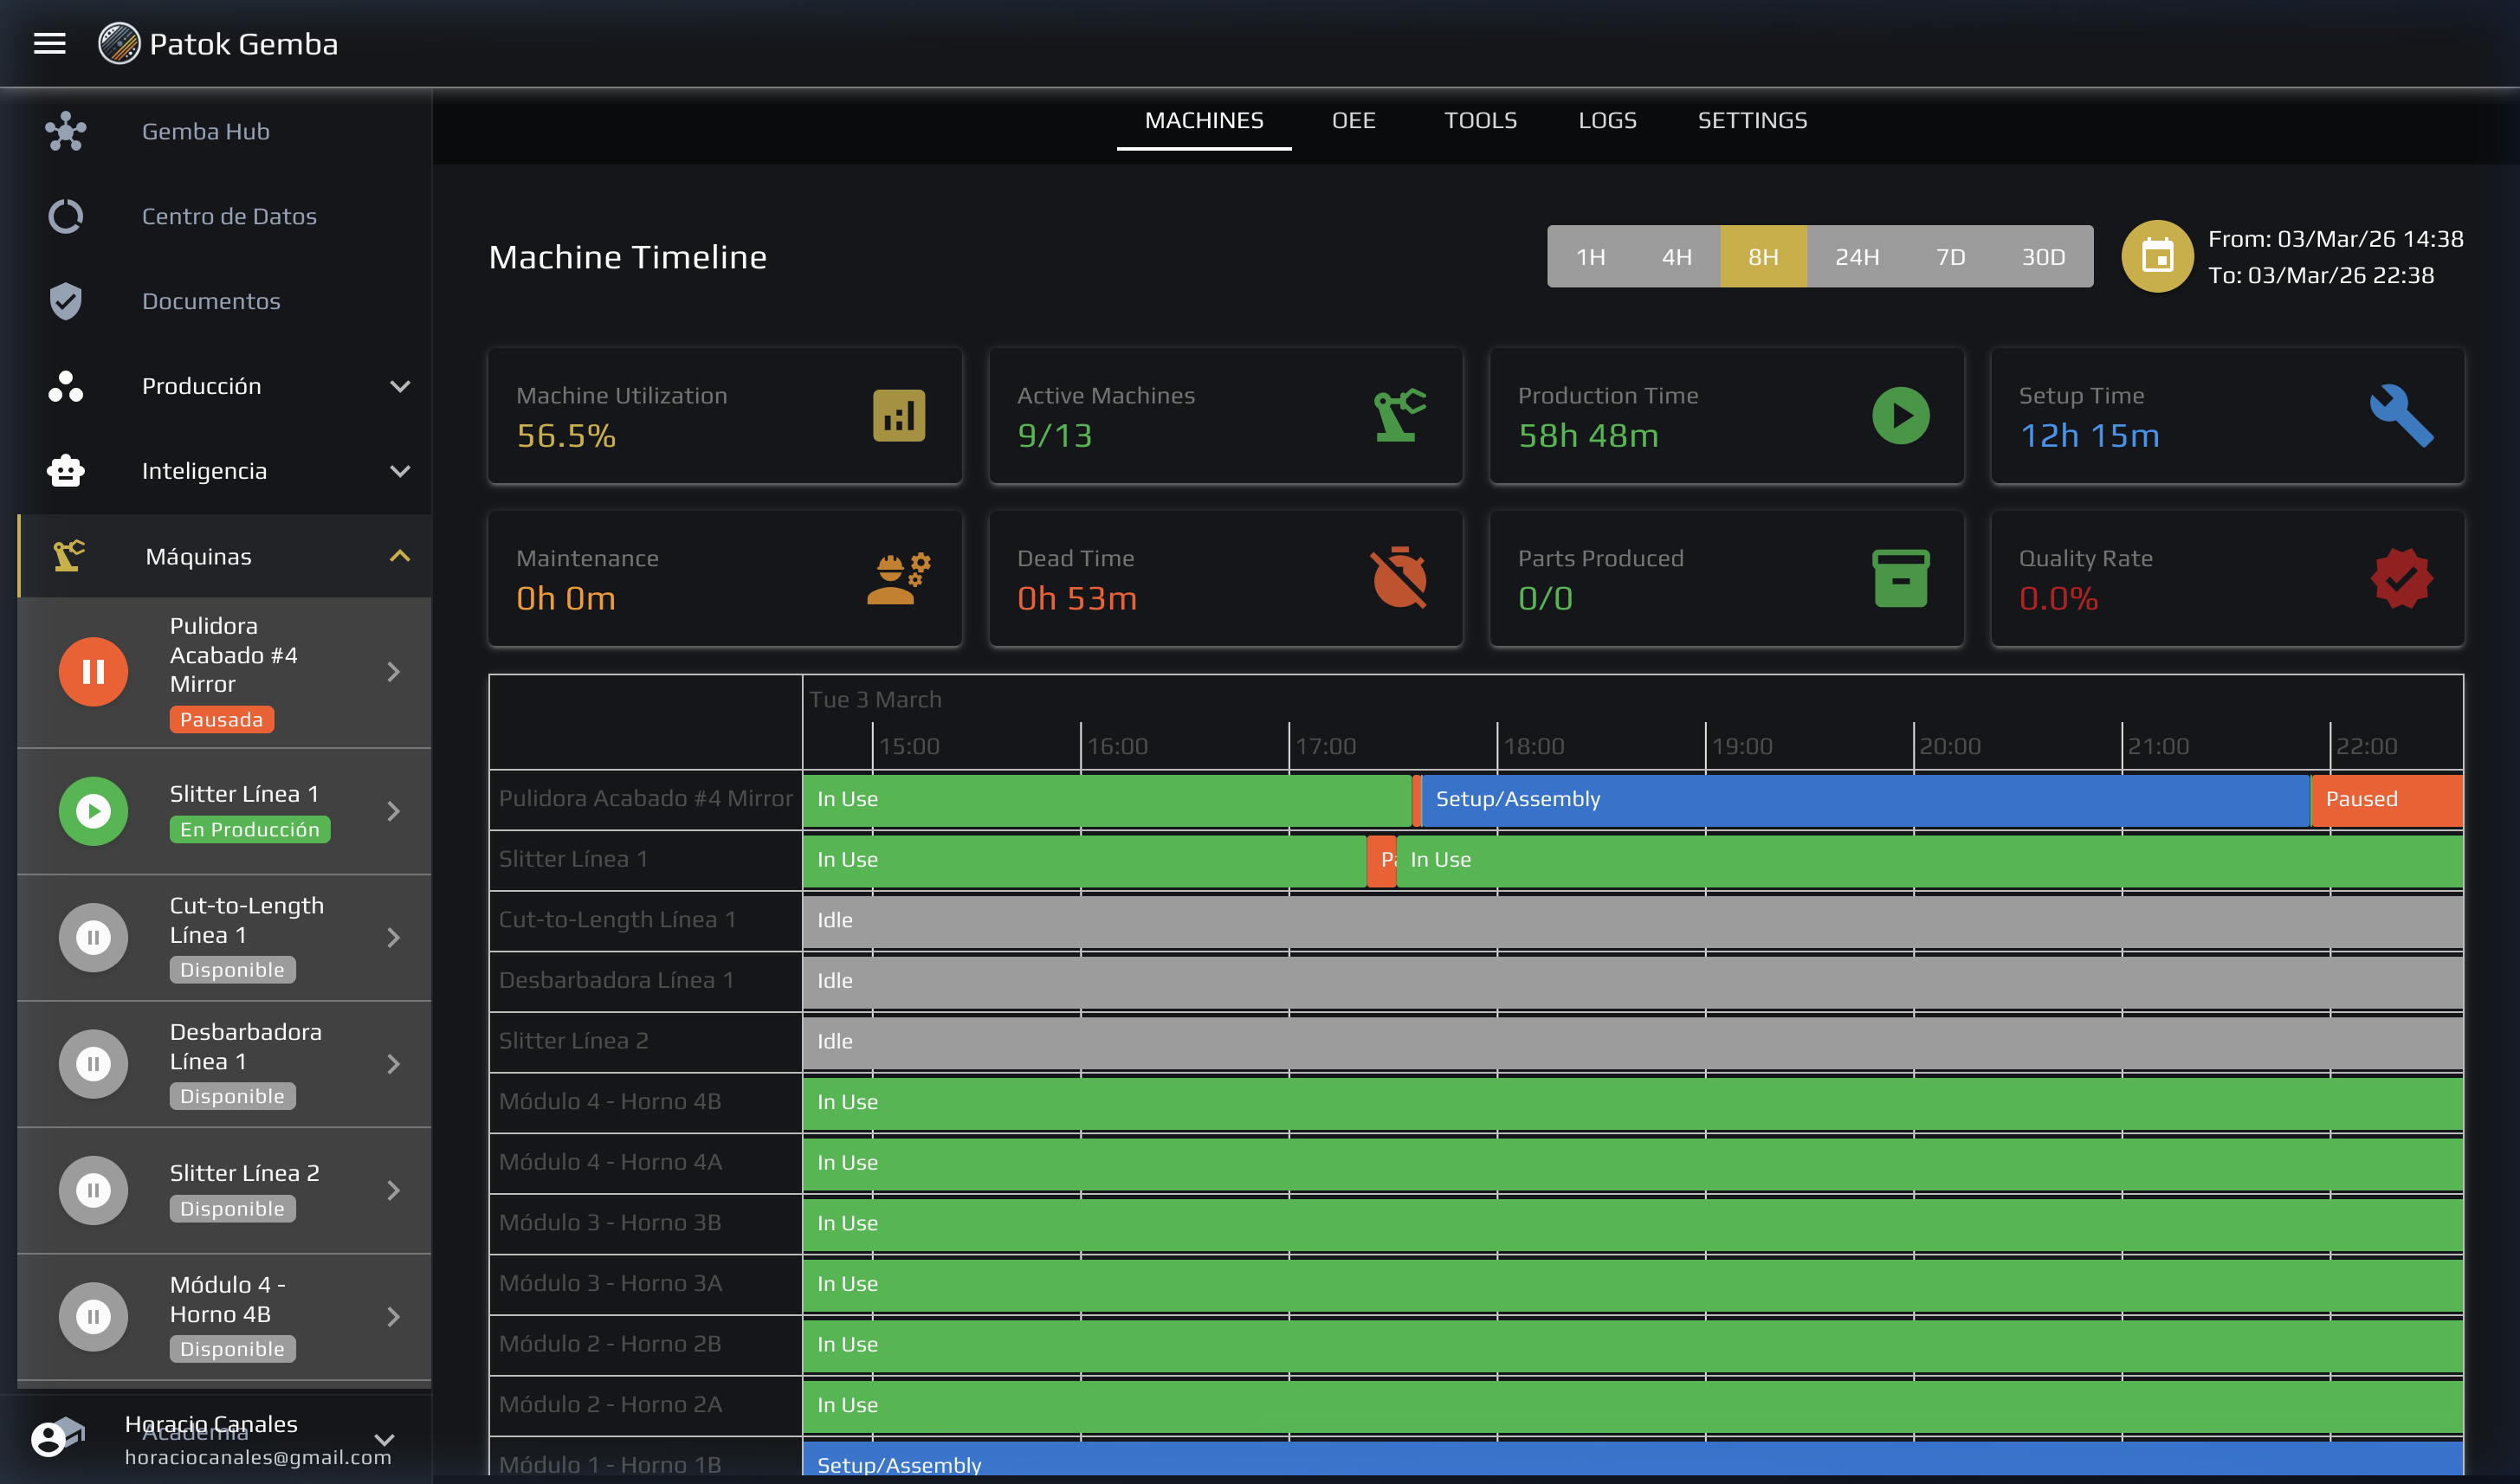
Screenshots straight from the platform — no renders, no Photoshop.
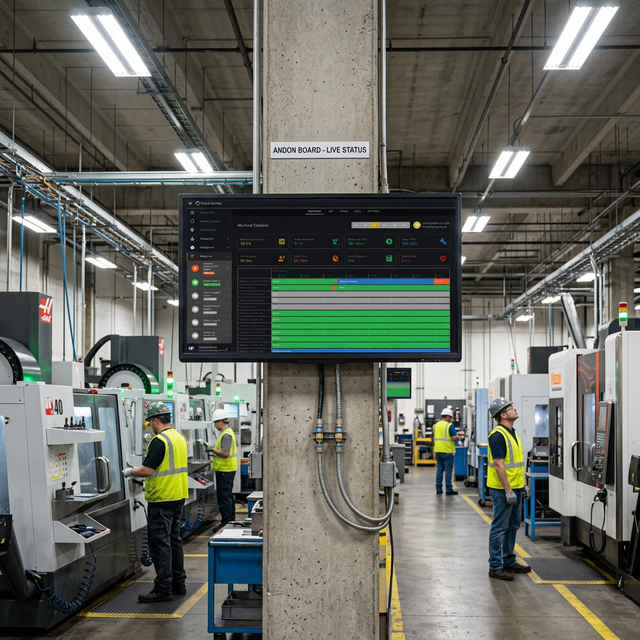
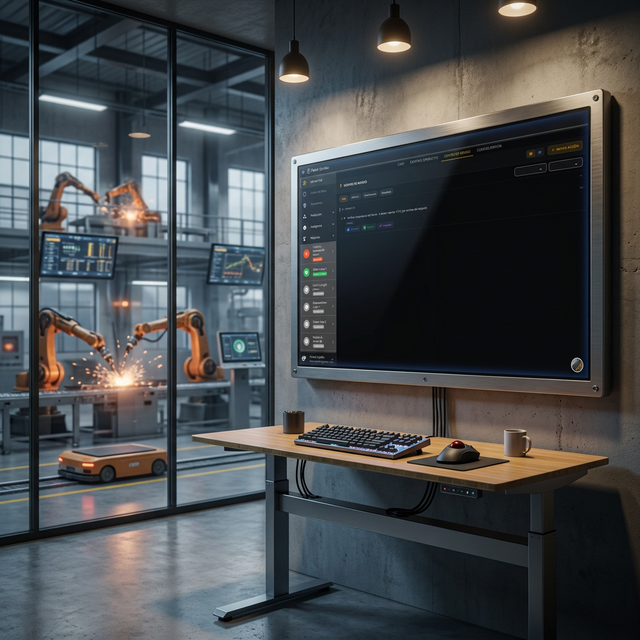
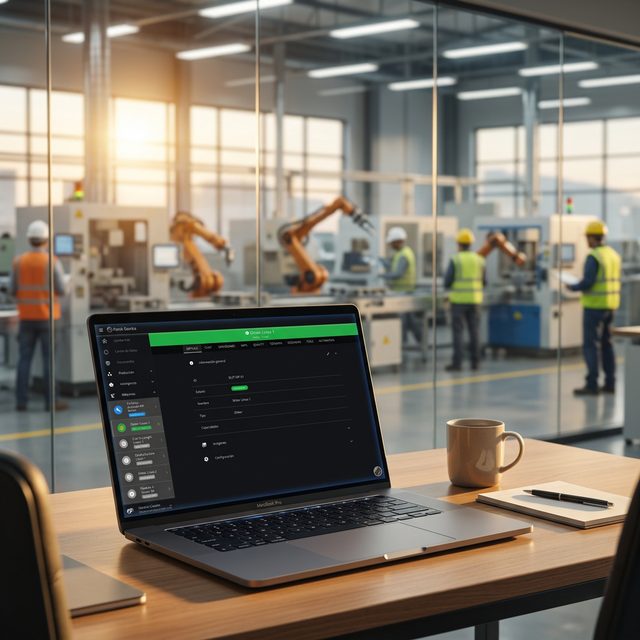
Designed for the shop floor
Monitors, Andon screens, laptops — the Digital Twin adapts to any surface.
Bring the Digital Twin
to your plant.
Full visibility of your operation in under 72 hours. No sensors, no complex integrations, no production stoppage.