Listen to your plant.
Before it screams.
Patok detects acoustic anomalies and machine states before they turn into downtime. No SCADA. No IoT sensors. With what you already have.
Calendar-based maintenance is not enough
A machine does not fail because the calendar says so. It fails because something changed — and nobody noticed.
Reactive maintenance
The machine stops, the shift halts, the technician runs. Every unplanned stoppage costs hours of production and thousands in losses.
Calendar vs. reality
The calendar says "service every 3 months". The machine says "I need attention now". Nobody is listening to the machine.
No health data
You have no way of knowing whether the machine is degrading. You only find out when it stops — and by then it is too late.
Patok detects it. Before you fail.
Audio, vision, and operating data — three signals that anticipate the problem.

Hear what the machine is not telling you
Microphones capture noise and vibration patterns. A shift in the acoustic profile signals wear, misalignment, or fatigue — weeks before failure.
- Anomaly detection in real time
- Patterns of progressive degradation
- Alerts before unplanned downtime
Availability, utilization, and MTTR
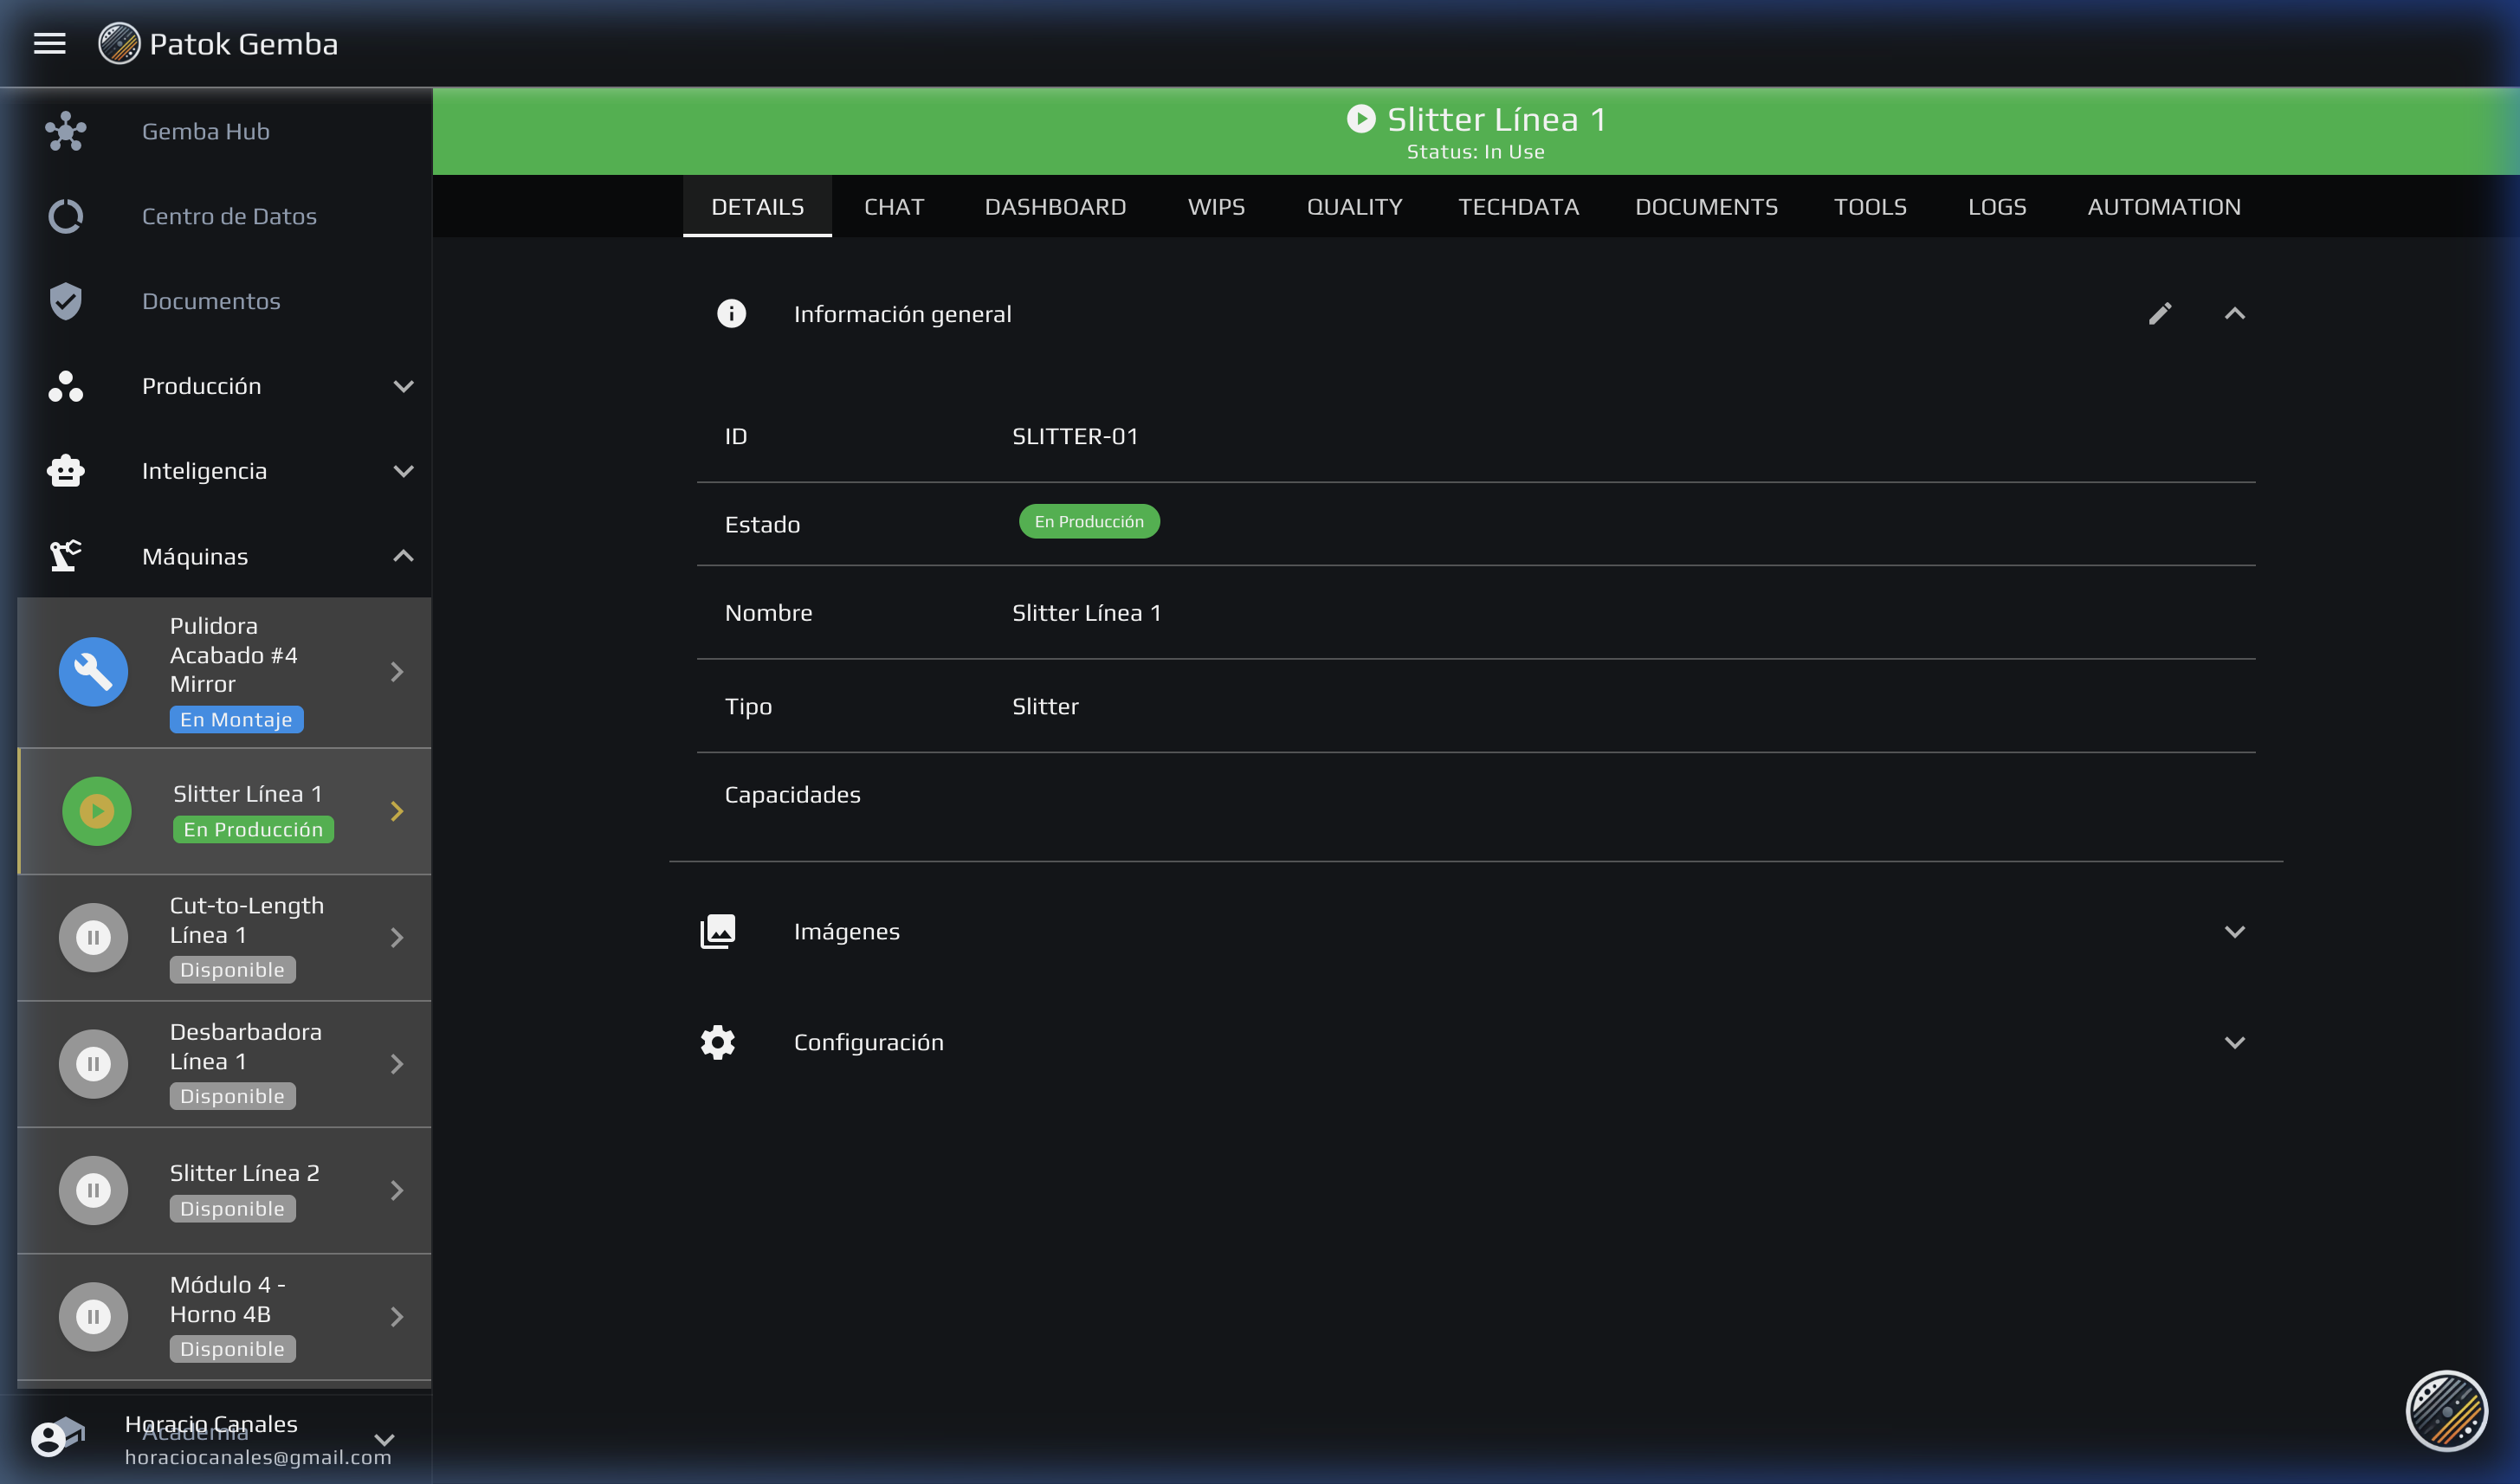
Every machine has its own dashboard with state history, productive vs. unproductive time, and availability metrics. The technician arrives with a diagnosis before touching the machine.
- Gantt timeline of states by shift
- Automated MTBF and MTTR metrics
- History of interventions and downtime

Automatic failure escalation
When a machine stops, Patok escalates the alert: first to the operator, then to the supervisor, then to the manager. On screen, over WhatsApp, and by push notification.
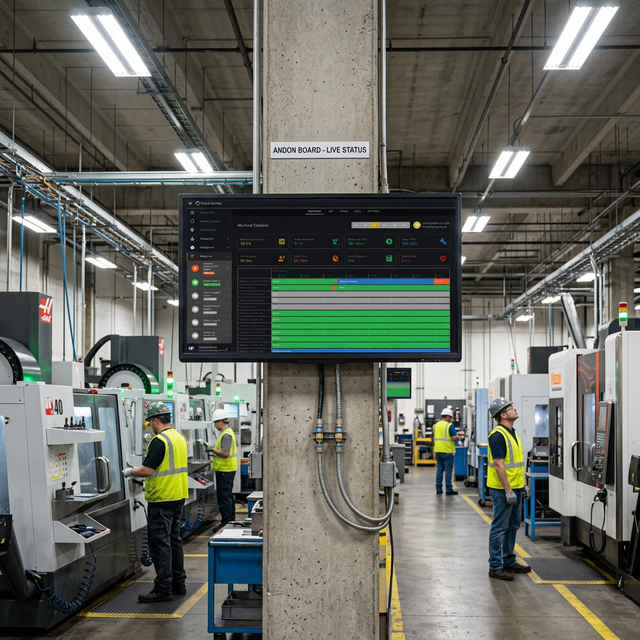
- Digital Andon visible on a plant TV
- Level-based escalation with a timer
- Notification to the manager if downtime persists
Calendar-based maintenance vs Patok
| Criteria | Calendar | Patok |
|---|---|---|
| Basis for the decision | Fixed dates | The machine's actual condition |
| Anomaly detection | After it already failed | Weeks before failure |
| Diagnosis time | Technician investigates on site | Dashboard ready on arrival |
| Asset availability | Low (over/under maintenance) | Optimal (precise intervention) |
| Failure escalation | Manual, by phone | Automatic, multi-level |
| Intervention log | Paper logbook | Digital with timestamp and evidence |
Cut your downtime.
Without modernizing everything.
Patok detects anomalies with the sensors that already exist: cameras, microphones, and operating data. No IoT investment. No new SCADA.