OEE: The Definitive Guide for Manufacturing

Learn what OEE is, how to calculate it step by step, what the 6 big losses are, and how to improve your equipment's overall effectiveness. A complete guide for production engineers.
OEE: The Definitive Guide for Manufacturing
If you are a production engineer, plant manager or operations director, you have probably heard the term OEE hundreds of times. Maybe you calculate it by hand. Maybe it lives in a spreadsheet nobody updates. Or maybe you simply don't measure it and know you should.
This guide is built to fix all of that. We cover everything from the definition to real implementation, with practical examples, clear formulas and strategies you can apply on Monday in your plant.
What Is OEE?
OEE stands for Overall Equipment Effectiveness. It is the single most important metric for measuring the real productivity of a machine, a line, or an entire plant.
OEE combines three dimensions of performance into one percentage:
- Availability: how much time was the machine ready to produce, versus how much time it should have been?
- Performance: is it producing at the theoretical speed, or slower?
- Quality: how many good parts come out, versus how many are rejected?
OEE = Availability × Performance × Quality
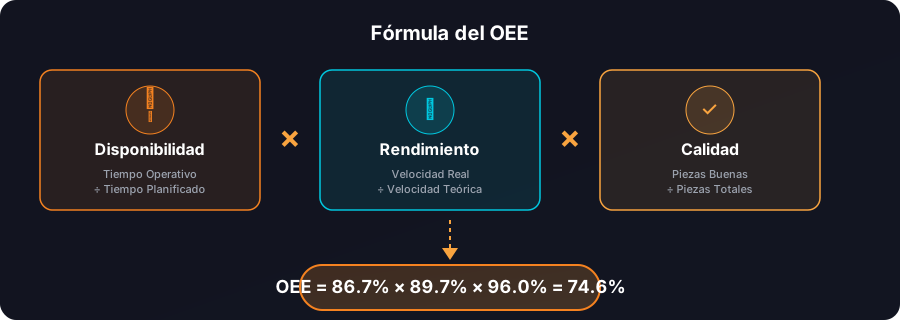
An OEE of 100% means you produce only good parts (quality), at maximum speed (performance), with no downtime (availability). In practice, an OEE of 85% is already considered world-class.
Why Does OEE Matter?
Because it is the only metric that tells you the whole truth about your equipment. You can have a machine that "never stops" but runs slow. Or one that flies but produces 30% scrap. OEE captures all of it in a single number.
For production engineers in discrete manufacturing — metalworking, plastics, automotive, food — OEE is the compass pointing at where the biggest improvement opportunities are.
The OEE Formula: Full Breakdown
1. Availability
Measures the percentage of time the machine was actually producing versus the planned time.
Availability = Operating Time / Planned Production Time
Example: your shift is 8 hours (480 min). Subtract 30 min of planned lunch. Planned time = 450 min. The machine stopped 45 min for setup and 15 min for a failure.
Operating Time = 450 - 45 - 15 = 390 min
Availability = 390 / 450 = 86.7%
What reduces availability?
- Model changes (setup / changeover)
- Mechanical or electrical failures
- Waiting for material
- Waiting for an operator
- Unplanned start-ups and shutdowns
2. Performance
Measures the real speed versus the machine's theoretical speed.
Performance = (Parts Produced × Ideal Cycle Time) / Operating Time
Example: in those 390 operating minutes the machine produced 350 parts. The ideal cycle time is 1 min/part.
Performance = (350 × 1) / 390 = 89.7%
What reduces performance?
- Micro-stoppages (the machine jams for seconds)
- Reduced speed from tool wear
- Poor-quality material that forces a slower pace
- An inexperienced operator who doesn't feed it in time
3. Quality
Measures the percentage of parts that come out good the first time versus total production.
Quality = Good Parts / Total Parts Produced
Example: of the 350 parts produced, 14 were rejected for defects.
Quality = (350 - 14) / 350 = 336 / 350 = 96.0%
What reduces quality?
- Process defects (dimensions out of tolerance)
- Material out of specification
- Setup errors (the first part of the lot)
- Rework from incorrect adjustments
Total OEE for the Example
OEE = 86.7% × 89.7% × 96.0% = 74.6%
An OEE of 74.6% is a very common starting point for plants that begin measuring. There is plenty of room to improve.
The Six Big Losses
The OEE concept comes from TPM (Total Productive Maintenance), developed by Seiichi Nakajima in Japan. Nakajima identified 6 categories of loss that hurt equipment productivity:
Availability Losses
- Equipment failures — unplanned stoppages from mechanical, electrical or software breakdowns. The most visible ones, and usually the first to get attention.
- Setup and adjustments — the time it takes to change from one product to another, adjust parameters, warm up the machine or make the first good part. In discrete manufacturing with high product variety, this is usually the biggest time thief.
Performance Losses
- Micro-stoppages — stoppages of seconds or a few minutes that look insignificant individually, but add up to 10-15% of the time. A sensor that trips, a part that jams, an alarm somebody resets.
- Reduced speed — the machine runs, but not at its nominal speed. It could be wear, difficult material, operator instructions, or simply that nobody remembers what the optimal speed was.
Quality Losses
- Process defects — parts that don't meet specification and go to scrap or rework during stable production.
- Start-up losses — defective parts during start-up, model change or warm-up. The first parts of the lot, usually discarded.
How Do You Eliminate Them?
The key is making them visible first. You cannot improve what you don't measure. Most plants have no systematic way of recording these 6 losses — they dissolve into the informality of the daily grind.
A system like Patok records cycle times, stoppages and machine states automatically, making every one of these losses visible without depending on the operator.
OEE Benchmarks: What Counts as "Good"?
| OEE level | Rating | Context |
|---|---|---|
| < 40% | Critical | Serious problems in availability, speed or quality |
| 40% – 60% | Low | Common in plants with no systematic measurement |
| 60% – 75% | Average | Typical of plants that are starting to measure |
| 75% – 85% | Good | Continuous improvement active, TPM under way |
| 85%+ | World-class | The world-class manufacturing benchmark |
Context for Latin America
In our experience working with plants in Mexico, Colombia and the region, average OEE without digital measurement sits between 45% and 65%. The main reason isn't bad machines — it's that the losses are invisible.
When a plant starts measuring OEE digitally, the first three months usually reveal 15-25 percentage points of improvement potential nobody knew existed.
How to Calculate OEE in Your Plant: 3 Approaches
Approach 1: Manual Log Sheets
The most basic method. The operator fills in a sheet with:
- Production start and end times
- Stoppages and their reason
- Parts produced
- Parts rejected
Pros: zero investment, operator awareness. Cons: imprecise data, administrative burden, nobody analyzes it, micro-stoppages vanish.
Approach 2: Semi-Automatic Spreadsheet
A step forward. Data is captured on paper and typed into a spreadsheet with preset formulas at the end of the shift.
Pros: low cost, you can generate charts. Cons: delayed data (you always see the past), entry errors, the spreadsheet breaks, it depends on one person.
Approach 3: Digital, in Real Time
The most effective method. A digital system automatically records machine events: when it starts, when it stops, how many parts it makes, how many are good.
Pros: data accurate to the second, immediate visibility, automatic history, proactive alerts. Cons: requires investment in software and possibly hardware.
With solutions like Patok, this approach needs no expensive IoT sensors — the operator scans a QR code to start and end operations, and the system computes times automatically. It is the most accessible way to get real digital OEE.
Metrics That Complement OEE
OEE doesn't work alone. For a complete picture of your production, you need to understand these related metrics:
Lead Time vs Cycle Time vs Takt Time
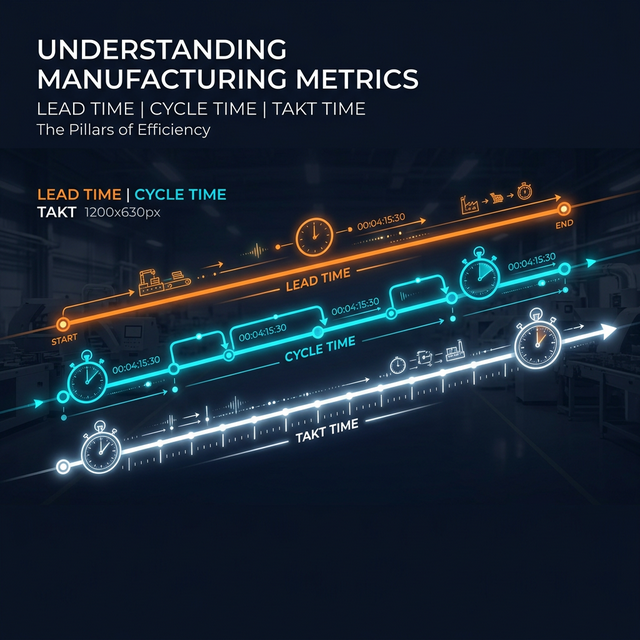
These three time metrics are fundamental and frequently confused. Our dedicated article on Lead Time, Cycle Time and Takt Time explains them in detail, but here is the quick version:
- Cycle time: how long it actually takes to make one part (door to door of the machine)
- Lead time: how long a part takes from entering as raw material to leaving as finished product
- Takt time: the rate you must produce at to meet customer demand
OEE feeds directly off cycle time to compute the Performance component.
Throughput
Throughput is the real production rate: parts per hour, per shift or per day. It is the visible result of OEE. Improve your OEE and your throughput rises automatically.
Bottlenecks
A bottleneck is the workstation or machine that caps the throughput of your whole line. There is no point optimizing the OEE of a machine that isn't the bottleneck — you would be improving something that doesn't move the overall result.
Learn how to find and remove bottlenecks in our article on Production Bottlenecks.
Strategies to Improve OEE
1. Make the Invisible Visible
The first step isn't "improving" — it is measuring. Most plants that start measuring OEE digitally discover their real OEE is 15-20 points below what they believed.
How? Implement digital logging that captures:
- The start and end of every operation
- The reason for every stoppage (categorized)
- Good parts versus defective parts
2. Attack Setup First
In discrete manufacturing with a high product mix (high variety, small lots), changeover is usually loss number one. Apply the principles of SMED (Single-Minute Exchange of Dies):
- Separate internal activities (machine stopped) from external ones (machine running)
- Convert internal activities into external ones
- Standardize and simplify what remains
3. Implement Autonomous Maintenance
Train operators to do basic inspections, lubrication and cleaning. This prevents 70% of the minor failures that cause unplanned stoppages.
4. Standardize Cycle Times
If you don't have a documented standard cycle time for each product on each machine, your Performance calculation is guesswork. Use time studies or, better, let the digital system learn the real times and set the standards.
5. Implement Visual Control (Mieruka)
Visual boards at each workstation show the operator their OEE in real time — target vs actual. That creates an immediate feedback loop that drives improvement.
6. Use Pareto to Prioritize
Don't try to fix everything at once. Build a Pareto of stoppages by frequency and duration. The top 3 stoppage types usually account for 70% of lost time. Attack those first.
OEE and Little's Law: The Connection Few People See
There is a deep mathematical connection between OEE and Little's Law, a fundamental formula in queueing theory:
WIP = Throughput × Lead Time
If your OEE drops, your throughput drops. If you want to keep the same output with lower throughput, your WIP (work in process) rises. More WIP means longer lead time, more money tied up in inventory, and more chaos on the floor.
Improving OEE doesn't only improve machine productivity — it cuts WIP, shortens lead times and frees up capital.
The Patok Digital Twin shows this relationship in real time: you can see how each machine's OEE affects the plant's overall flow.
OEE by Industry
Metalworking (CNC, lathe, milling)
- Typical OEE without measurement: 35-55%
- Biggest loss: setup (frequent tooling changes)
- Opportunity: digital SMED + automatic cycle times
Plastic Injection
- Typical OEE without measurement: 50-70%
- Biggest loss: start-ups and mold warm-up
- Opportunity: digital logging of temperatures and stabilization times
Assembly (Automotive Tier 2-3)
- Typical OEE without measurement: 45-65%
- Biggest loss: micro-stoppages and line imbalance
- Opportunity: visibility of cycles per workstation to rebalance
Food and Beverage
- Typical OEE without measurement: 40-60%
- Biggest loss: cleaning between lots (CIP) and sanitary regulations
- Opportunity: standardizing cleaning times with digital logging
Kanban and OEE: The Complete Flow
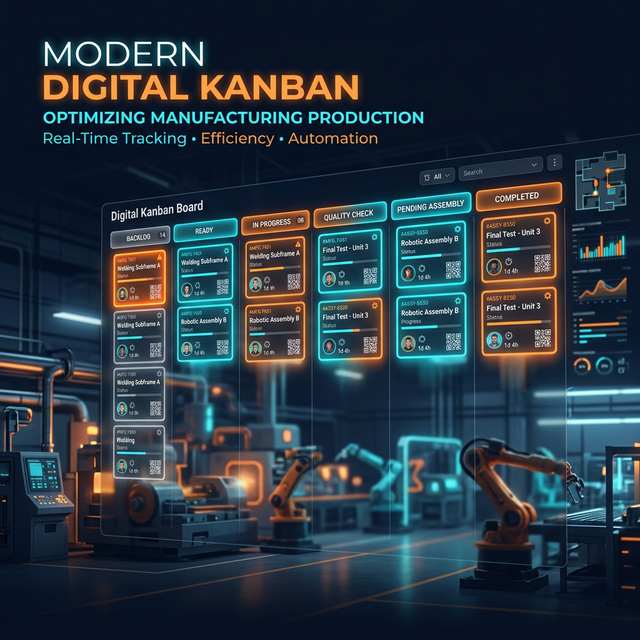
How does OEE connect to production control? Through Kanban. A digital Kanban system lets you control the flow of production orders based on real capacity data — and OEE is what determines that capacity.
If your OEE is 60%, your real capacity is only 60% of theoretical. A Kanban system that ignores this will overload your plant and create artificial bottlenecks.
Read more about implementing Digital Kanban in manufacturing and how it fits together with OEE monitoring.
Automating OEE With Patok
The Problem With Manual OEE
80% of plants that say they "measure OEE" do it with paper and spreadsheets. That introduces three serious problems:
- Delay: the data arrives 24-48 hours later. By the time you see it, the chance to act is gone.
- Inaccuracy: the operator rounds, forgets, or simply doesn't log micro-stoppages. Real OEE can be 15 points lower than what gets reported.
- Effort: somebody has to key in the data, calculate and present it. That costs person-hours that could go into improving.
How Patok Solves It
Patok Gemba automates OEE logging with no IoT sensors:
- Start with a QR code: the operator scans a QR code on the machine to start the operation. The system records the timestamp to the millisecond.
- State logging: setups, stoppages, active production — every state change is captured in real time, with its reason.
- Automatic close: when the operation or shift ends, the system automatically computes OEE broken down into Availability, Performance and Quality.
- Digital Twin: the Operational Control Dashboard shows each machine's OEE in real time, color-coded to say whether it is in range (green), tolerable (yellow) or critical (red).
- Automatic history: with no spreadsheet involved, the system generates OEE trends by machine, line, shift and product.
OEE vs TEEP: A Wider View
Once you have OEE down, the next level is TEEP (Total Effective Equipment Performance). Where OEE measures efficiency during planned time, TEEP measures efficiency across all calendar time — 24/7/365.
TEEP = OEE × Calendar Utilization
If your plant runs one 8-hour shift a day (33% of the day), even with an OEE of 85% your TEEP would be just 28%. That reveals how much potential capacity you have without buying equipment — simply by adding shifts.
TEEP is especially useful for operations directors weighing whether they need to invest in new machines or can grow with what they already have by optimizing shifts and cutting losses.
Frequently Asked Questions About OEE
Does OEE apply to continuous processes or only discrete ones?
Both, but it is most direct in discrete manufacturing (where you count parts). In continuous processes (chemicals, refining) it is adapted using production volume instead of parts.
Should I calculate OEE per machine or per line?
Both. OEE per machine tells you where the problems are. OEE per line tells you the real impact on throughput. Start per machine and then aggregate.
Is 100% OEE possible?
Technically yes, practically no. An OEE of 85% is already world-class. Chasing 100% brings diminishing returns and can create more problems than it solves (like scrapping all preventive maintenance so you "never stop").
How often should I review OEE?
Ideally in real time. At minimum, at the end of every shift. If you review it weekly, you are watching a film at one frame per week — you won't follow the story.
What is the difference between OEE and utilization?
Utilization only measures whether the machine is running or not. It ignores speed and quality. You can have a machine at 95% utilization but only 60% OEE because it runs slow and produces scrap.
Conclusion: OEE Is Your Starting Point
OEE is not the only metric that matters, but it is the best doorway into continuous improvement in manufacturing. It forces you to think about your equipment as a whole: are they available, are they fast, and do they produce quality?
If you don't measure OEE today — or measure it on paper — you are flying blind. The good news is that with the digital tools available now, you no longer need to spend millions on IoT sensors or enterprise MES systems. Solutions like Patok let you start measuring real OEE from day one, on the infrastructure you already have.
Your next step: calculate the OEE of your most critical machine for one week. The number will surprise you. And that moment of revelation is exactly where your plant's transformation begins.
Want to see how Patok computes OEE automatically in your plant? Book a free diagnostic Gemba Walk and find out your real OEE in under an hour.
Topics
Related Articles
More on OEE & Metrics

Ready to transform your plant?
Book a free adoption session and find your biggest opportunity to improve with industrial AI.
Book an Adoption Session