Lean Manufacturing in the Digital Era: The Complete Guide for Industrial Plants
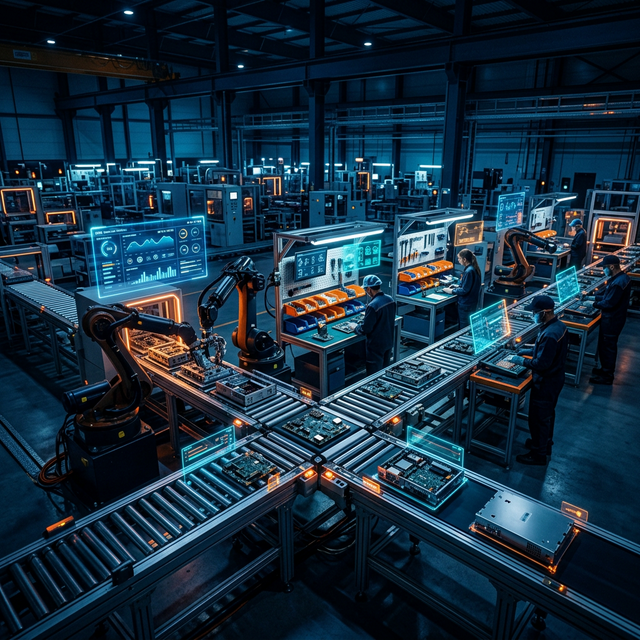
How to apply Lean Manufacturing with digital tools. Gemba Walk, Mieruka, 5S, Andon and Kanban strengthened with technology for manufacturing plants.
Lean Manufacturing in the Digital Era: The Complete Guide for Industrial Plants
Lean Manufacturing is over 70 years old. It was born at Toyota, spread across the world, and became the most influential production philosophy in history. Its principles — remove waste, continuous flow, constant improvement — are as valid today as in 1950.
But there is a problem: most plants apply Lean with 1990s tools.
Physical boards nobody updates. Log sheets that go missing. Gemba Walks that depend on the supervisor's memory. 5S that lasts exactly until the audit ends. Kanban made of sticky notes that fall off.
The tools failed. The principles didn't. And the good news is that we now have digital tools that make possible what Lean always promised: total visibility, immediate reaction, and continuous improvement based on real data.
This guide connects each pillar of Lean Manufacturing with its digital equivalent, with practical examples for discrete manufacturing plants.
The 5 Principles of Lean (A Quick Reminder)
Before we talk technology, let's anchor the fundamentals. Womack and Jones defined 5 principles in Lean Thinking:
1. Define Value
Value is defined by the customer. Anything that doesn't contribute directly to what the customer is willing to pay for is waste (muda).
2. Map the Value Stream
Identify every activity in the process — from raw material to finished product — and classify them as: value-adding, necessary but non-value-adding, or pure waste.
3. Create Flow
Remove the interruptions so the product flows without waiting, without unnecessary batches, without accumulation. The ideal is one-piece flow.
4. Establish Pull
Don't produce more than the next process needs. Work is pulled by demand, not pushed by the schedule.
5. Pursue Perfection
Continuous improvement (kaizen) never ends. Every day is a chance to remove one more waste.
The 7+1 Wastes (Muda) and How Technology Makes Them Visible
The heart of Lean is removing waste. Taiichi Ohno identified 7; an eighth has since been added:
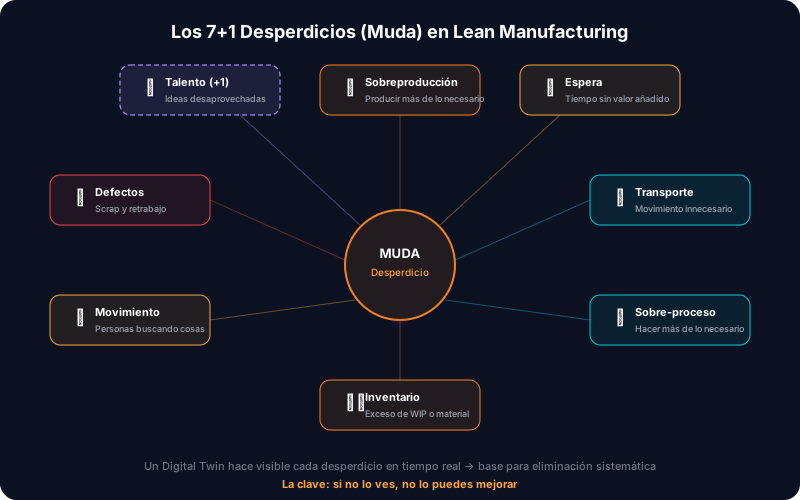
1. Overproduction
What it is: producing more than the customer ordered, or earlier than they need it.
How it shows up digitally: a system comparing accumulated output against the customer order in real time raises a flag the moment you overproduce. Without a system, the supervisor finds out at the end of the shift — or never.
2. Waiting
What it is: time a part, machine or operator spends doing nothing productive.
How it shows up digitally: the Digital Twin shows in real time how much WIP is queued at each workstation. If inspection has 50 parts waiting and the CNC next to it is empty, the waiting is visible instantly.
3. Transport
What it is: unnecessary movement of materials between workstations.
How it shows up digitally: location tracking of every WIP reveals the real movements. If a part goes from Cutting to the warehouse, then back to the floor for Turning, there is unnecessary transport the layout should eliminate.
4. Over-processing
What it is: doing more operations than needed. Polishing what nobody sees. Inspecting twice.
How it shows up digitally: real routing data — where each part actually went — reveals redundant operations or steps that add no value.
5. Inventory
What it is: excess raw material, WIP or finished goods.
How it shows up digitally: real-time WIP counts per workstation are the most powerful metric. Little's Law (WIP = Throughput × Lead Time) tells you exactly how much inventory you should have. Everything beyond that is waste. Learn more about these metrics in our OEE guide.
6. Motion
What it is: unnecessary movement of people — walking to find tools, going to ask for instructions, hunting for materials.
How it shows up digitally: by digitizing work instructions and order information, the operator has everything on their screen. No more walking to the office to ask "what do I do next?"
7. Defects
What it is: parts that don't meet specification.
How it shows up digitally: per-part quality logging — with photos, measurements and defect categorization — makes automatic Pareto analysis possible. OEE captures this in its Quality component.
8. Unused Talent
What it is: not using operators' ideas, skills and experience.
How technology helps: when data is available to everyone, not only the manager, operators can spot problems and propose improvements. Transparency generates participation.
Gemba Walk: From the Physical Walk to the Intelligent Gemba
What Is a Gemba Walk?
The Gemba Walk is the practice of "going to the place where things happen" — the production floor — to observe, ask and understand. Not an audit. Not an inspection. It is a leader going to the gemba with humility, to understand reality.
Go deeper in our dedicated article: What Is a Gemba Walk?
The Problem With the Traditional Gemba Walk
- The supervisor walks the plant but has no data in hand. They only see what is happening at that instant.
- Observations stay in their notebook — or their head — and rarely get systematized.
- There is no way to compare today's Gemba Walk with last week's.
- If the supervisor doesn't walk, nobody sees anything — the information dies with them.
The Digital Gemba Walk
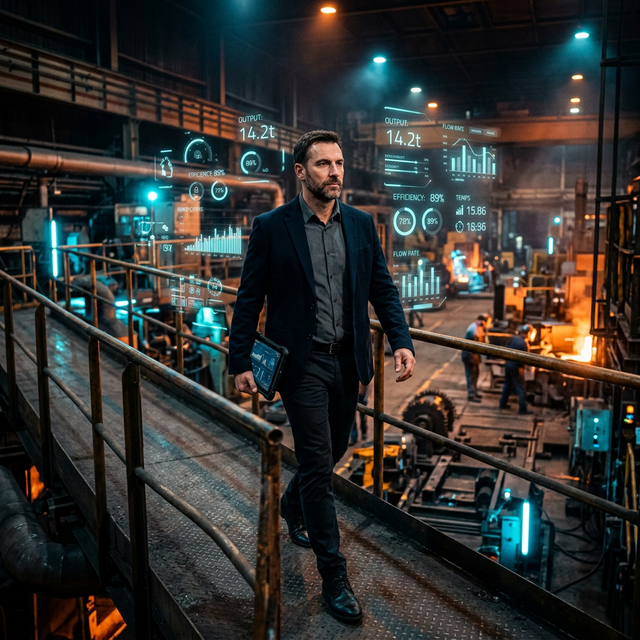
With tools like Patok Gemba, the Gemba Walk is strengthened with contextual data:
- You walk with a handheld or tablet. Approaching each machine, you scan its QR code and see: current state, shift OEE, queued parts, last incident, assigned operator.
- Digital observation records: every finding is documented with a photo, a category and the machine it belongs to. Nothing gets lost in a notebook.
- A history of Gemba Walks: you can compare this week's findings with last week's. Did the night shift problem get fixed? The data tells you.
- Remote Gemba Walk: with the Digital Twin you can do a "virtual Gemba Walk" from your office or another city. It doesn't replace walking the floor, but it fills the gap when you can't be there.
Mieruka: Visual Management on Steroids
What Is Mieruka?
Mieruka (見える化) means "to make visible" in Japanese. It is visual management applied to plant management: making the state of the process visible at a glance, without having to ask or dig for data.
Read the full article: Mieruka: Visual Management on the Floor
Traditional vs Digital Mieruka
| Aspect | Physical Mieruka | Digital Mieruka |
|---|---|---|
| Medium | Boards, whiteboards, lights | Screens, tablets, smart LEDs |
| Updating | Manual (somebody has to write) | Automatic (real-time data) |
| Reach | Only whoever is standing at the board | Anyone with access to the system |
| History | Erased at the end of the shift | Accumulates automatically |
| Metrics | Few (day's output, target) | Complete (OEE, cycle time, WIP, lead time) |
Digital Mieruka in Practice
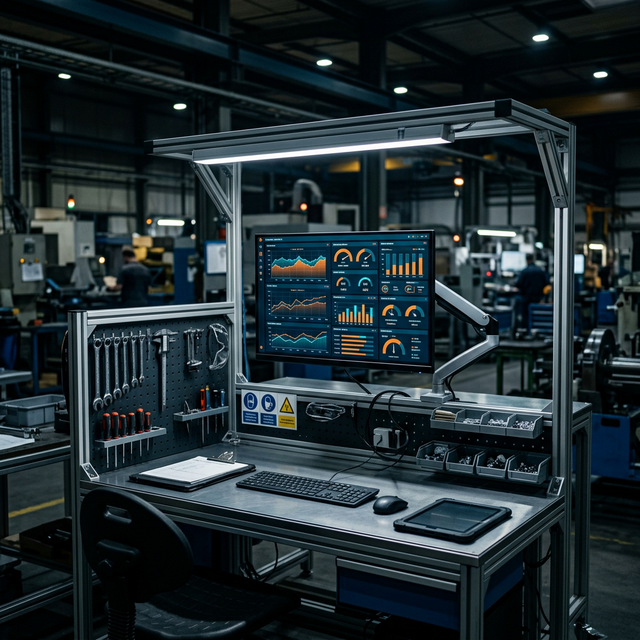
With Patok, every workstation can have a digital Mieruka poster: a screen or tablet showing:
- Shift target vs current output — are we on pace?
- Partial OEE — Availability, Performance and Quality right now
- Machine state — Running / Setup / Stopped (with elapsed time)
- Work queue — how many parts are waiting and which is next
- Active alerts — is there anything needing immediate attention?
The operator, the supervisor and anyone walking past understands the workstation's state in 3 seconds. That is real Mieruka.
Digital 5S: Beyond a Clean Floor
The Classic 5S
- Seiri (Sort): remove what isn't needed
- Seiton (Set in order): a place for everything
- Seiso (Shine): keep the area clean
- Seiketsu (Standardize): create visual standards
- Shitsuke (Sustain): keep the standards alive
The Problem: 5S Is Easy to Implement, Hard to Sustain
90% of plants that implement 5S abandon it within 6 months. Why? Because it depends on manual audits nobody keeps up. The launch enthusiasm fades and the plant returns to chaos.
Digital 5S
Technology doesn't do 5S for you — but it does solve the problem of sustaining and evidencing it:
- Digital checklists with photos: each shift, the operator completes a 5S checklist with photos of their workstation. Two minutes, done from the tablet.
- Automatic scoring: the system assigns a 5S score per workstation, shift and week. Low scores raise alerts.
- Visual history: before-and-after photos showing the evolution. When the director sees the visual difference over 3 months, 5S becomes permanent.
- Gamification: rankings of workstations by 5S score. Healthy competition between shifts motivates upkeep.
Digital Andon: Alerts That Escalate
What Is Andon?
Andon is the visual signaling system that raises the alarm when there is a problem on the line. Originally it was a cord the operator pulled to switch on a light and stop production.
The Big Problem With Physical Andon
Physical Andon lights have a visibility radius of about 20 meters. If nobody is looking at the light, nobody sees the problem. In large or multi-shift plants, that is a serious issue.
Digital Andon
A digital Andon escalates the alert to whoever needs to see it:
- Level 1: the operator reports a problem from their tablet → it appears in the Digital Twin immediately
- Level 2: if unresolved in 5 min → push notification to the supervisor
- Level 3: if unresolved in 15 min → notification to the production manager
- Level 4: if unresolved in 30 min → alert to the plant manager
Each escalation level is configured by problem type. A machine failure escalates faster than a missing material. Everything is documented with timestamps, photos and resolution.
The result: reaction time cut from hours to minutes. Nobody can say "I didn't hear about the problem".
Digital Kanban: A Pull System With Real Data
Physical vs Digital Kanban
Digital Kanban is perhaps the most impactful evolution. The pull-system concept is unchanged — you only produce what is needed. But execution changes radically:
- Automatic kanban signals: when WIP drops below the minimum at a workstation, the system generates the replenishment signal. It doesn't depend on somebody counting cards.
- Intelligent WIP limits: based on real capacity (current OEE), not static estimates.
- Omnichannel visibility: everyone sees the Kanban board — operator, supervisor, planner — from any device.
Kaizen With Data: Continuous Improvement That Works
The Problem With Kaizen Without Data
Many plants run periodic "kaizen events". The team gathers, analyzes a problem, proposes improvements, implements them, and… three months later nobody knows whether the improvement held.
Why? Because there was no baseline data and no way to verify the after.
Digital Kaizen
With historical data from the Digital Twin, a kaizen event transforms:
- Before: historical data shows the workstation's cycle time, OEE, lead time and WIP before the improvement. Not an estimate — real data from the last 4 weeks.
- During: the team analyzes the data, identifies the main losses (automatic Pareto) and proposes specific countermeasures.
- After: the same metrics are monitored automatically after the change. If cycle time dropped from 3.2 to 2.7 min, the data confirms it week after week.
- Sustain: if the metrics start drifting back, the system raises an alert. The improvement doesn't quietly disappear — the system protects it.
Hoshin Kanri: Strategy Deployment With Real Visibility
What Is Hoshin Kanri?
It is Lean's strategy deployment method: aligning management's objectives with the actions on the floor. Leadership defines the "True North" and each level of the organization translates those objectives into concrete actions.
The Traditional Problem
The strategy stays in the director's slide deck. The floor doesn't know the objectives. There is no connection between "improve on-time delivery to 95%" and what the operator does on their shift.
The Digital Connection
With a digital operating system, the operator sees on their screen:
- Their shift production target (derived from takt time, which comes from customer demand)
- Their current OEE versus the target
- Their contribution to the plant objective — "if I improve my cycle time by 10 seconds, the plant completes 3 more orders a week"
That closes the gap between strategy and execution. Hoshin Kanri stops being a diagram in the office and becomes data the operator sees every day.
Jidoka: Quality at the Source, Verified Digitally
What Is Jidoka?
It is the principle of "automation with a human touch": the machine — or the operator — detects a defect and stops production immediately so the error doesn't propagate.
Digital Jidoka
- Per-part inspection records: the operator logs dimensions or inspection results on the tablet. If a value falls outside specification, the system alerts — and can block the part from moving to the next workstation.
- Defect traceability: every defect is tied to the machine, the operator, the material and the time. Root cause analysis happens with data, not assumptions.
- Digital poka-yoke: the operator menu can guide the operator step by step, making sure they don't skip an operation or use the wrong material.
Toyota Management Culture and Digital Culture
Technology Does Not Replace Culture
Lean is not software. It is a way of thinking. No digital tool will create a Lean culture if leadership doesn't live it.
But technology can sustain and accelerate a culture that already exists:
- Radical transparency: when everyone sees the same data, there is no room for manipulation or favoritism. Data is democratic.
- Fact-based problem solving: "I think that…" gets replaced by "the data shows that…"
- Fair recognition: standout operators are identified by real data, not subjective perception.
- Speed of learning: new operators learn from the patterns of the best, documented digitally.
Lean Metrics Technology Finally Makes Accessible
Lean always had a powerful metrics framework. The problem was measuring them. Without technology, computing these metrics required weeks of time studies and dedicated analysts. Today a digital system calculates them automatically:
| Metric | What it measures | Why it matters |
|---|---|---|
| OEE | Real equipment effectiveness | The most complete indicator of machine productivity |
| Lead time | Total end-to-end time | What the customer feels |
| Takt time | The pace demand sets | Your target speed |
| First pass yield | % of parts good first time | Real quality, before rework |
| Total WIP | Parts in process in the plant | Capital tied up in inventory |
| Bottleneck score | The workstation capping flow | Where to focus improvement |
With these metrics in real time, your production meetings go from "what happened yesterday?" to "what are we going to improve today?"
Roadmap: Implementing Digital Lean in Your Plant
Weeks 1-2: Fundamentals
- Map your current value stream — raw material to finished product
- Identify your 3 main sources of waste (probably waiting, inventory and defects)
- Install basic digital capture: QR codes on machines + tablets at key workstations
Weeks 3-4: Visibility
- Turn on the Digital Twin with the machines configured
- Start measuring OEE at the bottleneck workstation
- Implement digital Mieruka — a visual board at each workstation
Month 2: Pull System
- Implement digital Kanban for order flow
- Set WIP limits per workstation
- Configure digital Andon with tiered escalation
Month 3: Continuous Improvement
- First kaizen event using baseline data from month 1
- Standardize the digital Gemba Walk with checklists and observations
- Measure and compare: before vs after with real data
If you want a step-by-step guide to get started, read How to Digitize Your Plant in 5 Steps.
Conclusion: Lean Didn't Die — It Evolved
The principles of the Toyota Production System are immortal. What changed is that we now have tools that make possible what used to be impractical:
- Mieruka that updates itself instead of boards nobody writes on
- Gemba Walks with data instead of walks from memory
- Kanban that doesn't fall off the wall instead of sticky notes that get lost
- Kaizen with automatic before/after instead of events nobody verifies
- Real-time OEE instead of a spreadsheet arriving 48 hours late
Lean manufacturing in the 21st century isn't about choosing between Lean and technology. It is about using technology to actually do Lean — the way it was always meant to be.
Your next step: pick a Lean tool you are trying to apply (5S, Kanban, Gemba Walk) and ask yourself: am I using 1990s tools on a 2026 problem? If the answer is yes, it is time to digitize.
Want to see what digital Lean Manufacturing looks like in practice? Book a free diagnostic Gemba Walk — we walk your plant with data in hand and show you what you had never seen.
Topics
Related Articles
More on Lean Manufacturing
Ready to transform your plant?
Book a free adoption session and find your biggest opportunity to improve with industrial AI.
Book an Adoption Session