7 Metrics Every Plant Should Track (and Probably Doesn't)

The 7 most important operational metrics in manufacturing that most plants don't track. Learn what to measure, why it matters, and how to start.
7 Metrics Every Plant Should Track (and Probably Doesn't)
Quick question: how many of these can you answer right now, without calling anyone?
- What is the OEE of your most critical machine today?
- How much WIP is on your floor at this moment?
- What was the real cycle time of the last part you produced?
- How long did your last setup take?
- What is your scrap rate this week?
- What is your on-time delivery rate this month?
- How long was your bottleneck stopped today?
If you answered 3 or fewer, you are flying blind. And you are not alone — 70% of industrial SMBs don't systematically track any of these.
These are the 7 metrics that separate plants that improve from plants that merely survive.
Metric 1: OEE (Overall Equipment Effectiveness)
What It Is
OEE is the master productivity metric. It combines three dimensions into one number:
- Availability: how much time was the machine ready?
- Performance: did it run at optimal speed?
- Quality: how many good parts came out first time?
OEE = Availability × Performance × Quality
Why It Matters
Because it is the only metric that tells you the whole truth about your equipment. A machine can be "always running" (high availability) but slow (low performance) and producing bad parts (low quality). OEE captures all of it.
What Most People Don't Know
Average OEE at manufacturing SMBs without digital measurement is 45-65%. Which means they are using between 45% and 65% of the capacity they already have installed. They don't need more machines — they need to use the ones they have better.
How to Start Measuring It
With a system like Patok, OEE is computed automatically as the operator logs the start and end of operations. No stopwatch, no sheets, no spreadsheets.
Metric 2: Real Cycle Time
What It Is
Cycle time is the actual time it takes to produce one part — from the moment the operator starts the operation to the moment they finish. Not the theoretical time from a time study, not what the CNC program says. The real time, part by part.
Why It Matters
Because it determines your real capacity. If your standard cycle time is 4 minutes but the real one is 5.2, your capacity is 23% lower than you think. And you are probably promising deliveries based on theoretical capacity, not real capacity.
What Most People Don't Know
Real cycle times vary 20-40% from documented standards. And they vary between operators, between shifts, and through the day (the 7 AM cycle time is rarely the 5 PM cycle time). Without continuous measurement, these patterns are invisible.
How to Start Measuring It
Every operation logged in Patok has a start and end timestamp. Cycle time is computed automatically, part by part, and compared against the standard.
Metric 3: Setup Time (Changeover)
What It Is
The time it takes to change a machine from one product to another. It includes: removing tooling, mounting new tooling, adjusting parameters, making the first part, and adjusting again until a good part comes out.
Why It Matters
In discrete manufacturing with high product variety — most SMBs — setup is frequently the biggest source of lost time. A plant with 6 setups a day at 45 minutes each loses 4.5 hours of production. That is more than half a shift.
What Most People Don't Know
Operators underestimate setup time by 30-50%. "I do the changeover in 20 minutes" becomes 35-40 minutes when you measure the real time, counting everything from the last good cycle of the previous product to the first good cycle of the new one.
How to Start Measuring It
When the operator logs a setup change in Patok, the system measures the full time: from the last part of the previous product to the first good part of the new one. That data is the basis for applying SMED (Single-Minute Exchange of Dies).
Metric 4: Work In Progress (WIP)
What It Is
The number of parts inside your production process at any given moment — not in the raw material warehouse, not in finished goods. The parts that are queued, in process, in inspection, or in internal transit.
Why It Matters
Because of Little's Law: WIP = Throughput × Lead Time. If your WIP rises and your throughput doesn't, your lead time grows. More WIP = longer delivery times, more money tied up, more parts exposed to damage, and more chaos on the floor.
What Most People Don't Know
Most plants don't know how much WIP they have until somebody does a physical count. And when they do, it is always more than expected. We have seen plants with 3× more WIP on the floor than their records showed.
How to Start Measuring It
With part-level traceability in Patok, WIP is counted automatically in real time. Every part created adds to WIP. Every part packed as finished goods subtracts. The Digital Twin shows total WIP and WIP per workstation, at any moment.
Metric 5: Scrap Rate (Inverse First Pass Yield)
What It Is
The percentage of produced parts that don't meet specification and go to scrap or rework. It is the inverse of First Pass Yield (FPY): if your FPY is 95%, your scrap rate is 5%.
Why It Matters
Every defective part is destroyed money: raw material + machine time + labor + energy, all spent on something you cannot sell. A 5% scrap rate in a plant producing $100K/month is $5,000/month straight into the bin.
What Most People Don't Know
The "official" scrap rate is usually lower than the real one. Why? Because scrap doesn't always get recorded. Parts with minor defects get "touched up" without documentation. Parts discarded as the first piece of a lot don't get counted. And parts the customer rejects show up as a "claim", not as "scrap".
How to Start Measuring It
In Patok, every part that passes inspection is recorded as conforming or nonconforming. Nonconforming parts are categorized by defect type. That automatically generates the defect Pareto you need to attack root causes with digital Poka-Yoke.
Metric 6: On-Time Delivery (OTD)
What It Is
The percentage of orders delivered on the date committed to the customer. If you committed to 100 orders this month and 82 arrived on time, your OTD is 82%.
Why It Matters
Because it is the metric your customer tracks. Your customer does not care about your OEE, your cycle time or your traceability. They care about one thing: did the order arrive on time?
Low OTD produces:
- Contractual penalties (especially in automotive and contract manufacturing)
- Lost customers (they move to whoever delivers)
- Last-minute express shipments (express freight costs)
- Unplanned overtime (premium labor cost)
What Most People Don't Know
Most plants measure OTD manually and in hindsight — "we had 3 late deliveries this month". But they have no proactive visibility: "order #4521 will be 2 days late unless…". By the time you detect the delay, it's too late.
How to Start Measuring It
With Patok, every order has a delivery date. The system automatically computes the order's progress against the committed date. If the order is running late, it raises an alert while there is still time to act.
Metric 7: Unplanned Downtime
What It Is
The time a machine is stopped for unplanned reasons: mechanical failures, electrical failures, lack of material, no operator, no instructions, quality problems that stop the line.
It does not include: scheduled preventive maintenance, lunch breaks, planned shift stops.
Why It Matters
Because unplanned downtime is the silent killer of productivity. A machine that stops 10 minutes every hour loses 80 minutes a day — nearly a full shift per week. And most of these stoppages are so short nobody logs them (the famous "micro-stoppages").
What Most People Don't Know
"Reported" downtime normally covers only major stoppages (failures over 30 minutes). Micro-stoppages — those 1-5 minute jams, adjustments and sensor trips — are invisible in manual records. But added up, they can account for 10-15% of productive time.
How to Start Measuring It
Patok logs every machine state change with a timestamp: running → stopped → setup → running. That captures both major stoppages and micro-stoppages, categorized by cause. The result is a downtime Pareto showing exactly where you are losing time.
The 7-Metric Dashboard
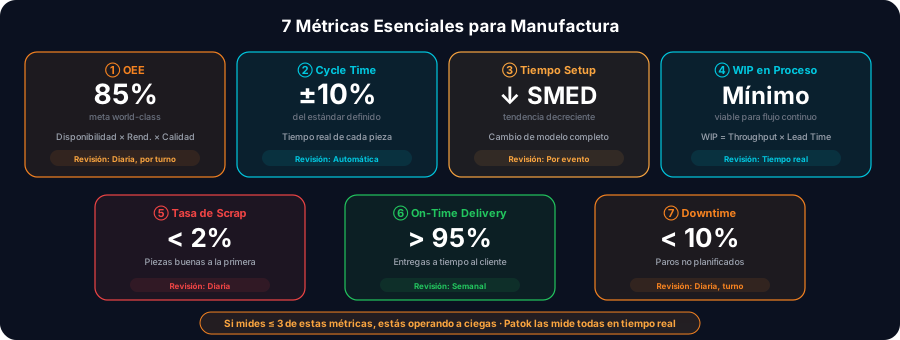
| # | Metric | Typical target | Review frequency |
|---|---|---|---|
| 1 | OEE | > 65% (good), > 85% (world-class) | Daily, by shift |
| 2 | Real cycle time | ≤ standard ± 10% | Per part (automatic) |
| 3 | Setup time | Varies by product, trending down | Per event |
| 4 | Work in progress | Minimum viable for continuous flow | Real time |
| 5 | Scrap rate | < 2% | Daily |
| 6 | On-time delivery | > 95% | Weekly |
| 7 | Unplanned downtime | < 10% of productive time | Daily, by shift |
Where Should You Start?
If you measure nothing today: start with OEE
OEE covers availability (downtime), performance (cycle time) and quality (scrap). By measuring it you automatically start tracking metrics 1, 2 and 5. It is the best entry point.
If you already measure OEE: add WIP and setup
WIP shows you the health of the flow. Setup shows you the biggest source of loss in high-variety discrete manufacturing.
If you measure all 7: congratulations — now optimize
The real power appears when you cross metrics. Examples:
- Low OEE + high setup → implement SMED
- High scrap on a specific machine → digital Poka-Yoke + maintenance
- High WIP + low OTD → an unidentified bottleneck
- High downtime from missing material → an internal logistics problem, not a production one
Conclusion: Measuring Is Not Optional
Plants that track these 7 metrics improve. Plants that don't stagnate or slide backwards. Not because measuring magically fixes problems — but because you cannot improve what you cannot see.
The good news: you no longer need an army of analysts, spreadsheets, or a million-dollar MES to track these metrics. With QR codes, tablets and a platform like Patok, you can have all 7 in real time in under 2 weeks.
Your plant already has the capacity to produce more, with less scrap and better delivery times. It just needs the eyes to see it.
For the complete step-by-step digitization guide, read how to digitize your plant in 5 steps.
Want to know where you stand on these 7 metrics? Book a free diagnostic Gemba Walk — in an hour we measure your real OEE and show you the opportunities you aren't seeing.
Topics
Related Articles
More on Practical Comparisons

Ready to transform your plant?
Book a free adoption session and find your biggest opportunity to improve with industrial AI.
Book an Adoption Session